Quick Look
Grade Level: High school
Time Required: 2 hours (wild guess!)
(two 60-minute class periods)
Subject Areas: Biology, Computer Science, Life Science, Measurement, Problem Solving, Science and Technology
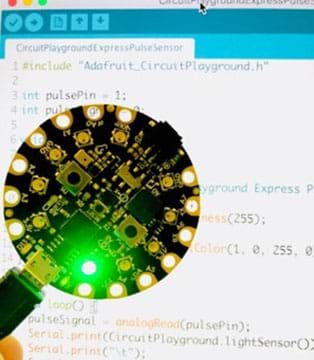
Maker Challenge Recap
For this maker challenge, students move through the engineering design process as they become biomedical engineers who design, create, and test a medical device that measures a patient’s pulse using a microcontroller, LED, and light sensor. Students use data collected from the device they build to determine how to best visualize the results, so that a doctor can view the patient’s pulse on the computer screen. During the challenge, students learn about basic coding, the capabilities of microcontrollers, how sensors gather data, how the human circulatory system works, and how to plot real data. Finally, students are challenged to make their systems portable so that they create wearable health technology. This is a great project for a high school senior design team project.
Maker Materials & Supplies
This activity works best with groups of 3 or 4.
Each group should get the following:
- Adafruit Circuit Playground Express (CPX) board https://www.adafruit.com/product/3333 (other microcontrollers could be used as well but other components will be needed. See below.)
- computer running Windows, OS X, or Linux (not tested with Chromebooks)
- spreadsheet program (the given instructions were tested with Google Sheets https://sheets.google.com/)
- Arduino Programming IDE https://www.arduino.cc/en/Main/Software
- microUSB cable (included with Circuit Playground Express)
- If using a different microcontroller, here are the additional parts needed
- multiple (3 or 4) LEDs of various colors
- set of three or four 200 – 400 ohm resistors for use with LEDs
- light sensor (photocell)
- 10k-ohm resistor for use with the photocell
- breadboards for building the circuit
Worksheets and Attachments
Visit [www.teachengineering.org/makerchallenges/view/rice3-2349-heartbeat-microcontroller-led-senor-design-challenge] to print or download.Subscribe
Get the inside scoop on all things Teach Engineering such as new site features, curriculum updates, video releases, and more by signing up for our newsletter!More Curriculum Like This

This lesson describes how the circulatory system works, including the heart, blood vessels and blood. Students learn about the chambers and valves of the heart, the difference between veins and arteries, and the different components of blood.
Kickoff
Do you know that you can measure your pulse with just a light on your finger and a sensor? This technique is called photoplethysmography and is pretty easy to do with the right tools.
Ask students: How can this work? (Listen to student responses.)
As your heart beats, there is a lub and a dub: your heart compresses to push blood through your circulatory system during the lub, called the systole (SIS-toe-lee), and then your heart relaxes and refills with blood during the dub or the diastole (die-AS-toe-lee). During the systole, there is a little more blood in your skin than during the diastole. If you shine light into your skin, the blood will interact with the light, and as the amount of blood changes during the cardiac cycle, you can detect this change by measuring the light leaving your skin.
The challenge: Each group is a team of biomedical engineers who are designing and testing wearable health systems that sense light changes with a person's pulse using a microcontroller, an LED, and a light sensor. Just as the eyes sense light and the brain processes the information to give it meaning, the microcontroller processes the signal it receives when the sensor detects light. The goal: to accurately measure the patient’s pulse and then convert the light signal measured to be a number that changes over time, giving doctors a visualization of the patient’s heartbeat. This is called a photoplethysmogram (PPG) waveform and has all kinds of uses in medicine.
Ask students: What color LED should you use? How will you get the light from the LED into your finger and then into the sensor? (Listen to student responses.) You and your fellow engineers must figure it out!
Resources
- Refer to the Engineering Design Process hub on TeachEngineering to guide your students through the challenge.
- Utilize the Engineering Design Process Notebook for design process documentation.
- Have students turn on the LED on their smartphones and hold their index finger over the bright light. You can see the light change as your heart beats!
- As an alternative to a smartphone, consider showing this 15-second video of an index finger held over an iPhone LED set of maximum brightness, which demonstrates the change in brightness as the heart beats. https://www.youtube.com/watch?v=jHRNMPfeDCY
- Students should play around with the LEDs on the board to figure out how to change color and brightness. https://caternuson.github.io/Adafruit_CircuitPlayground/
- Students will need to learn how to read from the on-board light sensor. https://caternuson.github.io/Adafruit_CircuitPlayground/lightSensor.html
- Starter Code: https://github.com/jimmynewland/paths-up-expeditions-in-computing-ret2018/blob/master/CircuitPlaygroundExpressPPG-starter.ino
- Example of pulse being read by CPX using completed code: https://www.youtube.com/watch?v=JuwK9bwggg0
Maker Time
The best way to start tackling this problem is to familiarize students with the tools at hand.
Arduino: First, students must learn to use the Arduino software and learn how to interface it with the Circuit Playground Express hardware. Next, there are 10 available LEDs which can display any color by combining different amounts of red, green, and blue light. Students will need to figure out how to control the brightness. (Note: For this project, there only needs to be one LED on. The others being on would be a source of light contamination so make sure students figure this out.) Ask the students to determine: Which LED is closest to the on-board light sensor? The students can find the light sensor by locating the icon of the open eye. It is very small indeed!
The basic challenge here is to turn on an LED and then read the light reflected off a finger into the light sensor. This data will then need to be displayed in the plotter tool to see the pulse in real-time!
Sensors: Sensors used by computers must give data in a digital form. The Arduino reads sensor data as voltage which is handled by the code as numbers. This means that the brightness of the reflected light will show up as numbers for the student engineers to process and display. Remember that when sensors read data, this counts as input data for the microcontroller. Students can then output this data in some useful way.
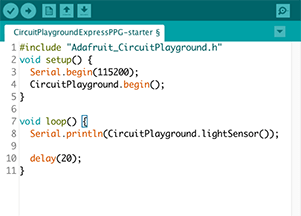
In the setup function for this code, we open a connection between the Circuit Playground Express and the computer using a reliable data transfer rate or baud. We must also tell the Circuit Playground Express to start up and be ready to do things like read from the sensors or change the colors of the LEDs. In the loop function, we do two simple things over and over. First, we get the light level reading from the Circuit Playground Express and print it to the serial console. Next, we add a 20-millisecond delay to allow the device to reset.
Students can access the serial console by selecting the Tools menu and then selecting Serial Monitor.
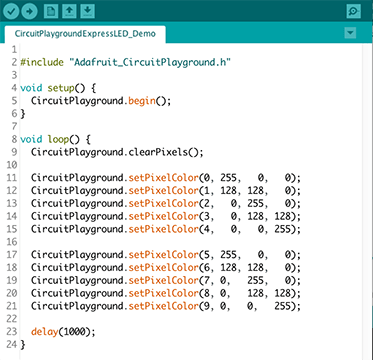
There is a built-in example if students need more help. Go to the menu Examples > Adafruit Circuit Playground > Hello_LightSensor for a complete working example of reading data from the light sensor.
Putting it together: Next, the students need to put together the various pieces: turn on the LED closest to the light sensor, read the light reflected back into the sensor, and print the values to the serial plotter.
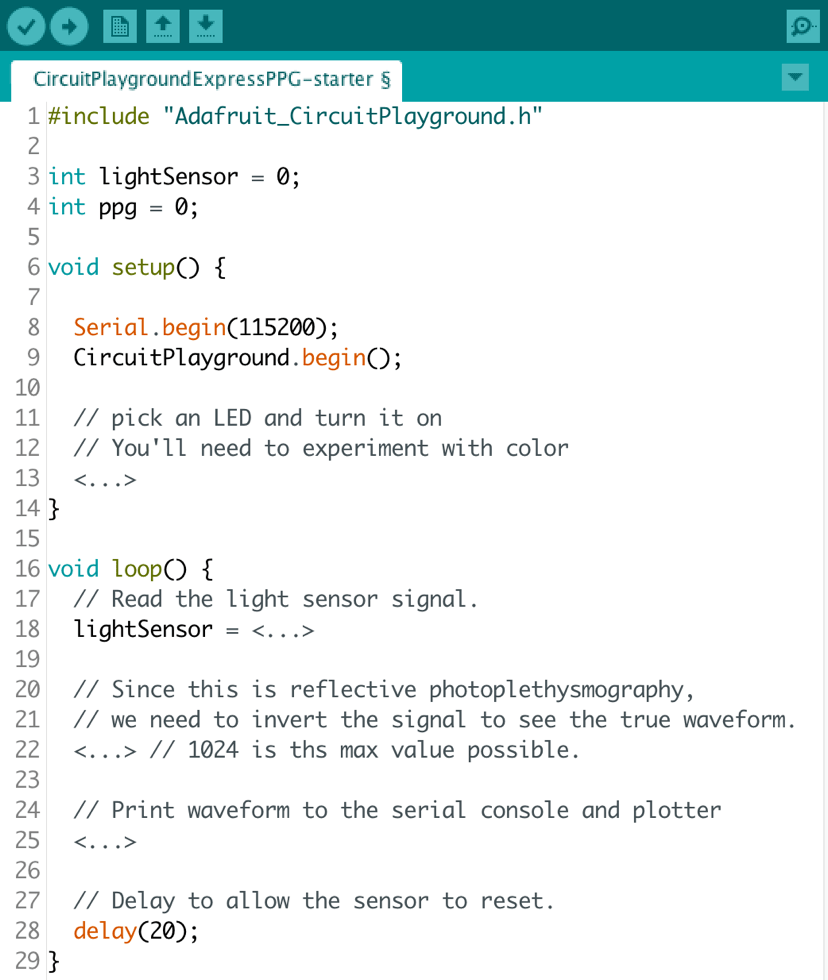
Students should start by setting up, just as we did before. The comments in Figure 1 are meant to be incomplete, so the students can complete them!
- Line 13 should have a line that turns on the LED at position 1 (that is the second LED since they start counting at 0). Starting counting at 0 is very common with computing.
- Line 18 needs to be finished so that the light sensor can be read directly.
- Line 22 is important! The light we get back from the sensor is the light that WAS NOT absorbed by the person’s tissue. We need to know how much light WAS absorbed. The maximum light value is 1024 (a power of 2 since this is a computer using binary). How can you change the number to represent how much light was absorbed rather than reflected back? Use the provided variable called PPG that was declared on line 4 to store your answer.
- Line 25 is where you print the result from line 22. This allows you to see the data in a raw format or to see the data plotted over time.
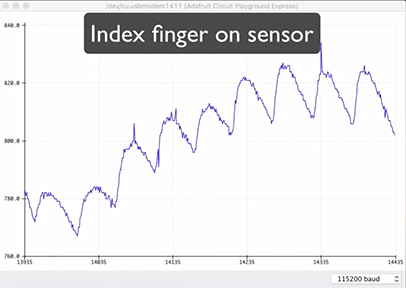
Once students load the program and it is running and plugged into their computer, go to Tools -> Serial Plotter and see the pulse in real time!
While testing the device, have students find a comfortable position and hold still for a full minute. Notice that signal calms down and changes. Suggest that the students try it out on different fingers and with a neighbor. Note that how hard a student presses does matter to the output. Have the students experiment with different positions and pressure levels. Ask the students: Which finger works best?
Wrap Up
Students should share their code and waveforms with the one another.
As a class: Discuss where difficulties arose and tackle questions about how students’ algorithms compared with one another.
Ask the students: Now that you have used a microcontroller as a health device, how could this system be made more portable? What other sorts of data could sensors access that might tell us something about a person’s health?
Tips
- Students will need to be allowed to explore the programming environment if this is their first programming experience. The time estimate includes some time for pure exploration.
- For a more challenging project, consider not including the starter code but only the two example programs. This would be appropriate if most students have some coding experience.
Copyright
© 2018 by Regents of the University of Colorado; original © 2018 Rice UniversityContributors
Jimmy NewlandSupporting Program
Research Experience for Teachers, Office of STEM Engagement, Precise Advance Technologies and Health Systems for Underserved Populations and Department of Electrical and Computer Engineering, Rice UniversityAcknowledgements
This activity was developed as part of the Research Experience for Teachers through the Office of STEM Engagement and the Department of Electrical and Computer Engineering at Rice University supported by the National Science Foundation under grant number IIS 1730574. Any opinions, findings and conclusions or recommendations expressed in this material are those of the authors and do not necessarily reflect the views of the National Science Foundation or Rice University.
Special acknowledgements to Christina Crawford, Allen Antoine with the Rice University Office of STEM Engagement, and Amruta Pai and Akash Maity with the Scalable Health Labs at Rice University for their help and support in developing this activity.
Last modified: July 27, 2020


User Comments & Tips