
Quick Look
Grade Level: 11 (11-12)
Time Required: 3 hours
(two 90-minute sessions or four 45-minute sessions)
Expendable Cost/Group: US $0.00 This activity uses non-expendable items such as the pulse oximeter which costs $35.
Group Size: 2
Activity Dependency: None
Subject Areas: Algebra, Biology, Computer Science, Life Science, Science and Technology
Quick Look
- Grade Level:
- 11 (11 – 12)
- Time Required:
- 3 hours
(two 90-minute sessions or four 45-minute sessions)
- Group Size:
- 2
- Subject Areas:
-
Algebra Biology Computer Science Life Science Science and Technology

Summary
Students learn that trigonometric functions can model how their hearts work and can provide important information about their cardiovascular condition. Students analyze their own photoplethysmogram (PPG) obtained from a fingertip pulse oximeter. Using a graphic user interface (GUI) developed in Microsoft Excel, students visualize a linear combination of sine functions to their PPG data. Once they obtain the best possible fit, students can use the GUI to determine important information about their hearts such as cardiac period and pulse interval.Engineering Connection
Healthcare providers use sophisticated equipment for diagnostic, surgery or monitoring. From a simple digital thermometer to a bulky and expensive computed tomography scanner, these technologies are the result of the work of thousands of engineers applying physics and mathematics to develop precise health diagnostic and monitoring devices. Engineering design has made possible to have small equipment like pulse oximeters to monitor heart activity without putting a patient in a doctor’s office or a hospital. In this activity, students use a similar mathematical analysis to obtain information about their personal cardiovascular condition.
Learning Objectives
After this activity, students should be able to:
- Understand how a photoplethysmogram (PPG) analyzes and outputs information.
- Use a digital pulse oximeter.
- Identify important cardiovascular information contained in a PPG graph.
- Learn that a superposition of basic trigonometric functions like sines and cosines can be used to describe a more complex periodic function.
Educational Standards
Each Teach Engineering lesson or activity is correlated to one or more K-12 science,
technology, engineering or math (STEM) educational standards.
All 100,000+ K-12 STEM standards covered in Teach Engineering are collected, maintained and packaged by the Achievement Standards Network (ASN),
a project of D2L (www.achievementstandards.org).
In the ASN, standards are hierarchically structured: first by source; e.g., by state; within source by type; e.g., science or mathematics;
within type by subtype, then by grade, etc.
Each Teach Engineering lesson or activity is correlated to one or more K-12 science, technology, engineering or math (STEM) educational standards.
All 100,000+ K-12 STEM standards covered in Teach Engineering are collected, maintained and packaged by the Achievement Standards Network (ASN), a project of D2L (www.achievementstandards.org).
In the ASN, standards are hierarchically structured: first by source; e.g., by state; within source by type; e.g., science or mathematics; within type by subtype, then by grade, etc.
NGSS: Next Generation Science Standards - Science
-
Create a computational model or simulation of a phenomenon, designed device, process, or system.
(Grades 9 - 12)
More Details
Do you agree with this alignment?
-
Use mathematical representations of phenomena to describe explanations.
(Grades 9 - 12)
More Details
Do you agree with this alignment?
-
Analyze data using computational models in order to make valid and reliable scientific claims.
(Grades 9 - 12)
More Details
Do you agree with this alignment?
-
Communicate scientific ideas (e.g. about phenomena and/or the process of development and the design and performance of a proposed process or system) in multiple formats (including orally, graphically, textually, and mathematically).
(Grades 9 - 12)
More Details
Do you agree with this alignment?
-
Models (e.g., physical, mathematical, computer models) can be used to simulate systems and interactions—including energy, matter, and information flows—within and between systems at different scales.
(Grades 9 - 12)
More Details
Do you agree with this alignment?
-
When investigating or describing a system, the boundaries and initial conditions of the system need to be defined.
(Grades 9 - 12)
More Details
Do you agree with this alignment?
Common Core State Standards - Math
-
Model with mathematics.
(Grades
K -
12)
More Details
Do you agree with this alignment?
-
Interpret functions that arise in applications in terms of the context
(Grades
9 -
12)
More Details
Do you agree with this alignment?
-
For a function that models a relationship between two quantities, interpret key features of graphs and tables in terms of the quantities, and sketch graphs showing key features given a verbal description of the relationship.
(Grades
9 -
12)
More Details
Do you agree with this alignment?
-
Analyze functions using different representations
(Grades
9 -
12)
More Details
Do you agree with this alignment?
-
Graph functions expressed symbolically and show key features of the graph, by hand in simple cases and using technology for more complicated cases.
(Grades
9 -
12)
More Details
Do you agree with this alignment?
-
Graph exponential and logarithmic functions, showing intercepts and end behavior, and trigonometric functions, showing period, midline, and amplitude.
(Grades
9 -
12)
More Details
Do you agree with this alignment?
International Technology and Engineering Educators Association - Technology
-
Students will develop an understanding of and be able to select and use medical technologies.
(Grades
K -
12)
More Details
Do you agree with this alignment?
-
Students will develop an understanding of the relationships among technologies and the connections between technology and other fields of study.
(Grades
K -
12)
More Details
Do you agree with this alignment?
-
Medical technologies include prevention and rehabilitation, vaccines and pharmaceuticals, medical and surgical procedures, genetic engineering, and the systems within which health is protected and maintained.
(Grades
9 -
12)
More Details
Do you agree with this alignment?
State Standards
Texas - Math
-
Mathematical process standards. The student uses mathematical processes to acquire and demonstrate mathematical understanding. The student is expected to:
(Grades
9 -
12)
More Details
Do you agree with this alignment?
-
apply mathematics to problems arising in everyday life, society, and the workplace;
(Grades
9 -
12)
More Details
Do you agree with this alignment?
-
use a problem-solving model that incorporates analyzing given information, formulating a plan or strategy, determining a solution, justifying the solution, and evaluating the problem-solving process and the reasonableness of the solution;
(Grades
9 -
12)
More Details
Do you agree with this alignment?
-
Functions. The student uses process standards in mathematics to explore, describe, and analyze the attributes of functions. The student makes connections between multiple representations of functions and algebraically constructs new functions. The student analyzes and uses functions to model real-world problems. The student is expected to:
(Grades
9 -
12)
More Details
Do you agree with this alignment?
-
graph functions, including exponential, logarithmic, sine, cosine, rational, polynomial, and power functions and their transformations, including af(x), f(x) + d, f(x - c), f(bx) for specific values of a, b, c, and d, in mathematical and real-world problems;
(Grades
9 -
12)
More Details
Do you agree with this alignment?
-
analyze situations modeled by functions, including exponential, logarithmic, rational, polynomial, and power functions, to solve real-world problems;
(Grades
9 -
12)
More Details
Do you agree with this alignment?
-
develop and use a sinusoidal function that models a situation in mathematical and real-world problems; and
(Grades
9 -
12)
More Details
Do you agree with this alignment?
Materials List
Each group needs:
- Personal computer, preferably running Windows software with the Snipping Tool installed
- Microsoft Excel
- MS-Excel PPG-Pulse-Analysis-GUI to analyze photoplethysmography
- CMS-50D Plus Fingertip Pulse Oximeter with mini USB interface and computer software assistant, available online or CONTEC CMS-P PC-based pulse oximeter blood oxygen SPO2 monitor+PC software+USB, available online
- Note: in the event pulse oximeters are not available, use data from a database of PPG pulses + graph analysis worksheets in Excel. Shimmer, a company that produces wearable wireless sensing products, has sample Pulse PPG data available for download. Have students create a pulse amplitude vs time graph for 5 seconds of data.
To share with the entire class:
- Student Activity Guide, one per student
- Activity Pre-Assessment, one per student
Worksheets and Attachments
Visit [www.teachengineering.org/activities/view/rice4-2386-trigonometric-functions-heart-modeling-ppg-pulses] to print or download.Pre-Req Knowledge
Students need to know trigonometric functions, including:
- Frequency, period, phase, and amplitude
- The superposition (addition and subtraction) of two or more periodic functions produces another periodic function; students confirm this fact during activity, or if they are not aware of this fact, they will discover it
For the advanced part of this activity, students should have understand the derivative concept in calculus, and how to use it to obtain information about a function’s shape, such as the maxima, minima and inflection points.
Students should also have a working knowledge of how work in Excel worksheets and graph manipulation.
Introduction/Motivation
(Begin this activity by asking students these questions: Have you been in a hospital? What has caught your attention the most? Students may mention the wide range of medical equipment used by medical personnel. Emphasize that diagnostic tools available in a hospital is highly dependent on these medical technologies.)
Biomedical engineering is the application of the principles and problem-solving techniques in engineering to biology and medicine. (Show the video: So You Want to Become a Biomedical Engineer by edX.) Biomedical engineering focuses on the advances that improve human health and health care at all levels. There are many sub-disciplines within biomedical engineering, including the design and development of active and passive medical devices, orthopedic implants, medical imaging equipment, biomedical signal processing, tissue and stem cell engineering, just to name a few.
(Show the video: Pioneering Cardiovascular Engineering by Johns Hopkins Biomedical Engineering.) One area of focus for biomedical engineers is to research methods and advanced engineering techniques to study the cardiovascular system. Biomedical engineers frequently work with cardiologists and life scientists to develop new diagnostic techniques and treatment solutions for various diseases and congenital defects that affect the cardiovascular system. These can include artificial hearts and valves, pacemakers, techniques for treating arrhythmia and vascular issues, and the development of innovative diagnostic and imaging tools.
Today, you are going to begin an activity that involves a mathematical simulation of the heart. You are going to find a mathematical function that will model the way your own heart works. You will learn how to read the graph of this function and read data about your cardiovascular condition.
Procedure
Background
It is important for students to understand the terminology and concepts used in this activity. Reviewing the vocabulary and watching the linked videos in the Introduction/Motivation section above will help clarify the terminology. You may independently explore each one of these terms and concepts by researching them online. A brief summary of the important concepts in this activity is below:
Circulatory System
Heart Diastole and Systole: These terms refer when the heart relax and contracts. The diastole is the phase of the heartbeat when the heart muscle relaxes and allows the chambers to fill with blood. The systole is when the heart muscle contracts and pumps blood from the chambers into the arteries.
Electrical Activity of the Heart: Electrical signals flow along the heart and make it relax and contract. This electrical activity is illustrated in Figure 1: The sinoatrial (SA) node (1), which acts as the pacemaker of the heart, sends out an electrical impulse (2). This impulse makes the upper heart chambers (atria) contract, therefore opening the mitral and tricuspid valve and allowing blood to pump into the ventricles (3). After this contraction, the atrioventricular (AV) node sends an impulse into the ventricles (4). This second electrical impulse makes the lower heart chambers (ventricles) contract (5) pumping the blood out of the heart (6).

Electrocardiograms (ECG).
What an ECG can tell about heart: An ECG (see Figure 2 below for an example) measures the electrical activity of your heart to show whether or not it is working normally. It may determine whether high blood pressure has caused any damage to your heart or blood vessels. It may also detect cholesterol clogging up your heart’s blood supply, a heart attack in the past, enlargement of one side of the heart, or abnormal heart rhythms.

Pulse Oximetry
How pulseoximeters work: Pulse oximeters operate based how oxygenated blood absorbs light. The oximeter uses an electronic processor and a pair of small light-emitting diodes (LEDs); one LED is red, with wavelength of 660 nm, and the other is infrared with a wavelength of 940 nm. Oxygenated hemoglobin absorbs more infrared light and allows more red light to pass through, while deoxygenated hemoglobin allows more infrared light to pass through and absorbs more red light.

The pulse oximeter measures the amount of light not absorbed. These signals fluctuate in time because the amount of arterial blood that is present in the capillary vessels increases or decreases with each heartbeat. The processor (see Figure 3 above) manipulates these differences and obtains the oxygen saturation level, or amount of oxygenated hemoglobin in the blood (SpO2) and the heart rate. Finally, it compounds a graph displaying the volume changes of the capillary vessels, otherwise known as the photoplethysmogram, or PPG.
Ample research has shown that the shape of the PPG pulse is related with the cardiovascular conditions of a patient, and can be used to evaluate conditions as arrhythmia, arterial elasticity, arterial aging, and aortic valve condition. Other researchers have applied PPG data to diagnose other problems like preeclampsia in pregnant women. Figure 4 below illustrates the main parts of a PPG. The interpretation of the form and values of this signal is an important research line in clinical diagnosis.

APG Pulse, Arterial Stiffness, and Arterial Aging. (Activity scaling for higher grades) In mathematics the shape of a function is analyzed using a differential calculus techniques. First and second derivatives are used to find maximum and minimum points and concavity intervals. Clinical researchers have found that the PPG shape is strongly related with cardiovascular health. Arterial stiffness and arterial aging are depicted in the PPG pulse. After the analysis of hundreds of PPG pulses, they correlated mathematical formulas to quantify the severity of these health conditions. These formulas use the values of maximum and minimum points of the second derivative of the PPG pulse.
The second derivative of the PPG pulse, also known as acceleration plethysmogram (APG), is shown in Figure 5. The first derivative of the PPG pulse or velocity plethysmogram (VPG) is also shown below.

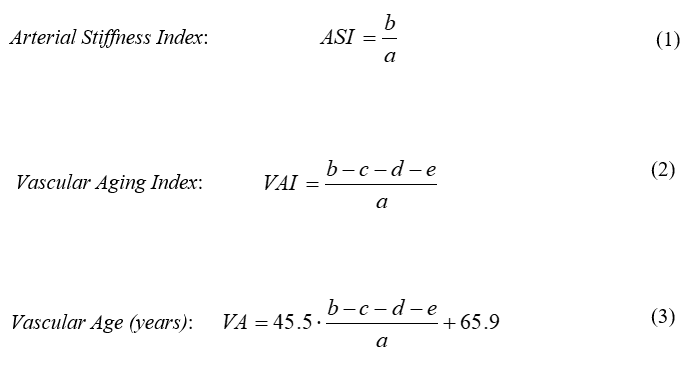
Figure 5 also illustrates how the shape of the second derivative can be related to overall blood circulation condition. Also are illustrated the correlations used to obtain formulas (1)-(3).
Fourier Theorem: The superposition of sine and cosine functions. This theorem states that a continuous periodic function on an interval [-L, L], i.e. that repeats every 2L or equivalently f (t + 2L) = f (t), may be expressed as the sum or superposition of an infinite number of sine and cosine functions, having every one of these terms a specific amplitude and frequency:

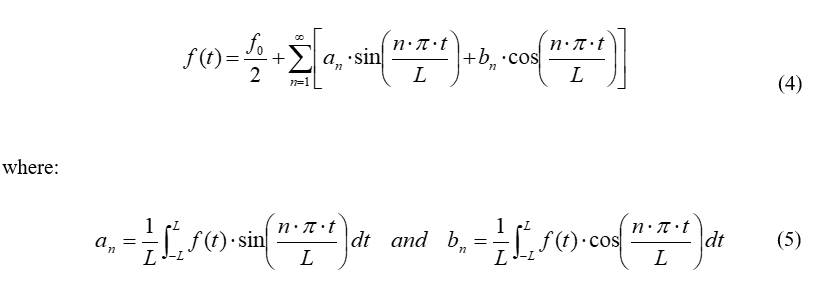
This result was obtained in 1822 by the French mathematician Joseph Fourier as part of the solution of the heat diffusion equation— the one used to model heat diffusion in a homogenous and isotropic media. This is the key concept to analyze and understand any periodic phenomena (see Figure 6). Fourier Theorem is fundamental in sound analysis.
In this activity the main idea is to understand the general concept, not the math involved in Fourier’s Theorem. The periodic PPG pulse will be approached as the superposition of up to five sine functions. The coefficients and frequencies of these functions will be approached by trial and error.
Before the Activity
- It is important that teacher master every step in this activity by performing their own PPG analysis. These results can be used as an example of the desired final product.
- Be familiar with the use of the CONTEC CMS50D+. Watch this video: Pulse Oximeter Review CMS50D+.
- Ensure that the SpO2 assistant software and Snipping Tool are installed in every computer and are working properly. Also verify that Excel is installed and working.
- Verify that each pulse oximeter works and connects with its computer software.
- Be sure students have enough experience manipulating Excel spreadsheets. They need to modify a graph’s scale or restore and insert some information. They have to know how to use the equation editor. Note: the GUI worksheets are not protected.
- Read all the attachments and practice the activity ahead of time.
- In the Student Activity Guide, adjust the red text on page 3 to reflect the amount of time that students will have to obtain their PPG pulses (either over two 90-minutes classes or four 45-minutes classes).
With the Students
Building Background
Introduce all the basic concepts students need to understand the objective of this activity. This will take about 45 minutes.
Play the video: The Heart and Circulatory System from the Mayo Clinic. An important question for students is: What are the main phases during the heart beat? The expected answer is: systole or when heart contracts and pumps blood, and diastole or when it relaxs and receives blood. Write these two phases on the board.
Play one of the videos next: ECG – Electrocardiogram by HeartWest or What is an EKG? by Henry Ford Allegiance Health. Direct students to have a brief discussion with a partner for about two to three minutes and tell them write a list with of pros and cons based on what they know about ECGs. An example of an ECG is shown in Figure 7.
.")
Examples of ECG pros:
- It offers a precise measurement of how the heart works.
- It can be used to detect many heart problems.
- Its diagnostic ability helps doctors evaluate precise treatments.
Examples of ECG cons:
- It must be performed in a clinic setting, such as doctor’s office.
- A specialized nurse or technician must perform the test.
- The equipment is complex, bulky, and expensive.
- A layperson may not be able to understand the graphs.
- The test cannot be performed frequently (because of the reasons above).
Next play Cardiac Conduction System and Understanding ECG by Alila Medical Media, which explains the electrical impulses that make the heart work. Students do not need a full understanding about the electrical impulses that make the heart work, but they should be able to identify the two main phases of heart beat: systole (compression) and diastole (relaxation), represented by the S-T segment and for the T-wave respectively.
Explain to students that even though the ECG can give a detailed condition of heart, there are simpler procedures that give important cardiac information, such as the heart’s periodic rhythm. Present the use of pulse oximeters as a non-invasive and easy-to-use alternative to monitor a heart rate. Use the first eight minutes of video from Pulse Oximetry NEJM as an introduction to basic concepts. The remaining eight minutes describes the use of pulse oximeters in medical care. (You may decide to play or skip this part.)
Next, play the first four and a half minutes of the video Pulse Oximeter Review CMS50D+. Through this video, students will learn how to operate the pulse oximeters. The video’s last five and a half minutes describe how to connect the device to a computer and the use of the pulse oximeter software.
Using the Pulse Oximeter
Students are now ready to the hands-on part of the activity, if there are pulse oximeters available. Have students select a partner or two to work with, depending on the number of pulse oximeters available and the number of students in your class. Distribute the pulse oximeters. Direct students to place a finger in the pulse oximeter and turn it on. Indicate they have to configure the pulse oximeter so it shows the pulse bar graph. Tell students to measure and write down their blood oxygen levels and pulses. Ask students about the curve in the pulse bar graph or photoplethysmogram (PPG). Ask students: What main characteristic do you see in this curve? Is it similar to an ECG curve? Student answers may vary to include: “it is also a periodic signal” or “it outlines how the heart is working.”
For this activity objective, it is essential students understand what the pulse bar graph indicates. Play the video What is Pulse Pressure? to help students learn about this curve. Note that important cardiovascular information can be extracted from the PPG curve. Display Figure 4 to show the different parts of this pulse.
It is important students identify every point on the PPG. Students do not have to fully understand the meaning of each point on Figure 4, considering this requires time and some medical background.

One example of an advanced topic that students should be able to identify, but do not necessarily have to explain, is the dicrotic notch. To clarify this concept, play the video Interpreting Arterial Pressure Waveforms by OPENPediatrics. The dicrotic notch is an indicator of the aortic (or vascular) elasticity. Because young people have more elastic arteries, the dicrotic notch will appear well defined on a PPG, while older people with less elastic arteries may have less well-defined PPGs (Figure 8).
Instruct students to recall parts of their mathematical background, specifically trigonometry. Pointing to the PPG pulse ask the following questions:
- From this graph, we can see that a healthy heart works in a “very periodic” way. Does this pulse reminds you something?
- Does it look like one of the functions you have studied? Possible answers include: “It is similar to a sine or a cosine” or “it is like the addition or superposition of a sine and a cosine.”
The last video Fourier Series Square Wave illustrates an important mathematical result that is widely used in physics and engineering. Periodic functions can be expressed as an infinite sum of simple sine and cosine functions. This expansion is known as Fourier series. It is studied in advanced mathematics courses. While playing the video, comment on how the addition of sine functions of different frequencies and amplitudes produces a square function, the more sine functions added, the more square the resulting function appears.
Repeat the purpose of the activity: “This is the objective of this activity: to approach a PPG pulse with the sum of at least two sine functions; the pulse you are going to approach is your personal PPG. So, you are going to find the trigonometric functions that model your heart beat, and you will use them to find your personal cardiovascular information."
Using the Pulse Oximeter Software
The steps students have to follow in this activity are illustrated in the Students Activity Guide. Decide according with the students’ skills which steps to model during the activity. A summary of these steps is presented below:
- Using the Pulse Oximeter and its Software Interface to obtain the PPG Pulse.
- Connect the USB Cable to the CMS 50D+ pulse oximeter and to a computer’s USB port.
- Insert a finger in the pulse oximeter. Turn-on and wait until you obtain a reading. Configure the pulse oximeter to display the PPG pulse by pressing alternatively the little white button.
- Run the pulse oximeter interface SpO2 Assistant.
- Click-on the connection button displayed by the SpO2 Assistant. On the Devices window select the COM port the pulse oximeter is connected to, and click the button Connect.
- Let the SpO2 Assistant window display a full and stable pulse. On the main menu click Edit -> Freeze Wave
- Open Snipping Tool, take a good snapshot of the frozen pulse, and save this image.

- PPG Pulse Analysis using the Excel Graphic User Interface.
- Look for the file PPG-GUI.xls, and double click-it. Select the worksheet PPG-Graph.
- IMPORTANT. Save a copy using your name as the new file’s name.
- Make the saved PPG pulse the background of the graph in worksheet PPG-Graph. To do this, follow the next steps.
- Click on the graph region.
- Press mouse right button.
- On the displayed menu select Format Plot Area.
- On the Format Plot Area expand FILL.
- Click on Picture or Texture Fill button.
- On the expanded menu Insert picture from, click the File… button, and select the PPG pulse file under your name.
- Adjusting Harmonic Function to PPG pulse
- Modify the frequency ω first. Find the value that makes the distance between maximums the same for both lines.
- Next modify shift parameter c1 of the first harmonic H.1. Find the value that makes the maximums of both lines overlap as much as possible.
- Modify now the value of the amplitude A1 for the first harmonic H.1, until the heights of both pulses match. It is possible that you have also to modify a little the value of the vertical shift h.
- Give now a value to the amplitude A2 of the second harmonic H.2. Try values about half the value of parameter A1.
- Try now values for the shift phase c2 for harmonic H.2. Try positives and negatives until get the best match possible of the two curves.
- It is now important to modify a little these six parameters in order to achieve the best fit of the two curves. This is a guess and check process, modify and see… This requires some patience. Don’t forget to save your GUI every time you get a good match. Keep a written record of the values producing a good match.
- A better match between the curves can be achieved using more harmonics. Repeat the process but giving now a value to the amplitude A3 of the third harmonic H.3, Begin with a value about half the value of the parameter A.2.
- Give a value to the shift phase c3 of harmonic H.3. Try again positive and negative values. You may also modify slightly the parameter A3, looking for the best match.
- It is possible to modify a little bit the first six parameters w, h, A1, c1, A2, c2, looking for the best possible fit. This process will require more time and patience.
- You can repeat the above process for the additional harmonics A4 and A5. This GUI allows built a periodic function with up to five harmonics. Figure 9 shows a match made using four harmonics.

- Reading Values on the Graphs Curves.
Values of the obtained harmonic function can be read on the graph in the Cardiovascular Analysis tab of the MS-Excel PPG-Pulse-Analysis-GUI attachment. This is an easy task that only requires a firm hand on the computer’s mouse. After selected the graph, carefully place the mouse pointer on the graph line and the software will display the corresponding coordinates for that point (Figure 10).

Vocabulary/Definitions
blood oxygen level: The extent to which hemoglobin is saturated with oxygen. Hemoglobin is an element in the blood that binds with oxygen to carry it through the bloodstream to the organs, tissues, and cells of the body. Normal oxygen saturation is usually between 96 percent and 98 percent.
cardiovascular system: A vast network of organs and vessels that is responsible for the flow of blood, nutrients, hormones, oxygen and other gases to and from cells. It is made up of three independent systems that work together: the heart (cardiovascular); lungs (pulmonary); and arteries, veins, coronary and portal vessels (systemic).
diastole: Phase of the heartbeat when the heart muscle relaxes and allows the chambers to fill with blood.
diastolic amplitude: The height or peak that indicates the reflections of the pressure wave by arteries of the lower body.
diastolic peak: Second highest point on the PPG waveform.
diastolic phase: Time interval in which the heart ventricles are relaxed and the heart fills with blood.
dicrotic notch: Inflection point or minimum between systolic and diastolic peaks representing the closure of the aortic or pulmonic valve at the onset of ventricular diastole; indicates the aorta’s flexibility.
electrocardiogram: Simple, noninvasive procedure to record the electrical activity of the heart. Electrodes are placed on the skin of the chest and connected in a specific order to a machine that, when turned on, measures electrical activity from the heart. Output usually appears on a long scroll of paper that displays a printed graph of activity on a computer screen. Commonly known as an ECG or EKG.
heart rate: Number of times the heart beats in one minute.
heart rate variability: Physiological phenomenon of variation in the time interval between heartbeats. It is measured by the variation in the beat-to-beat interval.
peak-to-peak interval: Time interval between two consecutive systolic peaks on a PPG waveform.
photoplethysmogram: A simple, non-invasive, and low-cost optical technique used to detect blood volume changes in the microvascular bed of tissue. It uses a sensor called a pulse oximeter to make measurements at the skin surface. The PPG waveform comprises a pulsatile (AC) physiological waveform attributed to cardiac synchronous changes in the blood volume with each heartbeat, and is superimposed on a slowly varying 'DC) baseline with various lower frequency components attributed to respiration, sympathetic nervous system activity and thermoregulation. Also known as a PPG.
pulse interval: Interval of time between the beginning and end of a PPG waveform.
systole: Phase of the heartbeat when the heart muscle contracts and pumps blood from the chambers into the arteries.
systolic amplitude: Height of the AC component of the photoplethysmogram, indicating changes in blood volume caused by arterial flow around the measurement site.
systolic peak: Highest point on the PPG waveform.
systolic phase: Time interval in which the ventricles contract and pump blood out of the heart and to arteries.
systolic-diastolic interval: Time delay between the systolic peak (pressure wave produced by the contraction of the left ventricle) and the diastolic peak (pressure wave reflected by the small arteries in the lower body). A decrease in this time interval indicates artery stiffness (low elasticity), a problem associated with aging.
vascular compliance: The ability of a blood vessel wall to expand and contract passively with changes in pressure. This is an important function of large arteries and veins. The ability to stretch in response to pressure has a large effect on the passage of fluid through the circulatory system, and blood pressure.
Assessment
Pre-Activity Assessment
Pre-Activity Assessment: The Pre-Activity Assessment helps students understand the different transformations a sine function can have, and will help students to understand the differences between the harmonics used to construct the function matching their PPG.
Activity Embedded Assessment
Check-In: Monitor that students are moving in the right direction and understand what they are doing. Use the Student Activity Guide to gauge this.
Post-Activity Assessment
Research Poster: Using PowerPoint or Google Slides, students will create a poster containing the following information. A rubric is included on page 2 of the Student Activity Guide.
- Title of the project, and student’s name.
- Description and purpose of the project.
- Background of the activity and a brief explanation of a PPG.
- Steps followed to find the harmonic function.
- Harmonic function and its graph.
- Summary of the cardiovascular information.
- Conclusions
Results Presentation: Have students present their results. Use the rubrics on pages 2 and 12 of the Student Activity Guide. Depending of the time available and group size:
- In-class presentation. Projecting their poster, students explain their work and results.
- Video-presentation. Students submit a video with their poster presentation, explaining their work and results.
Troubleshooting Tips
Feel free to contact the author (e-mail: mramirez2@galenaparkisd.com, phone: 1-(832) 386-2888 for any questions related to this activity.
Activity Scaling
For higher grades: Students with Calculus background will perform the portion of this activity in the Cardio Calculus-Analysis tab of the MS-Excel PPG-Pulse-Analysis-GUI attachment. Reading values on the second derivative graph of the adjusted harmonic function, students can obtain an estimation of their vascular stiffness index and vascular age.
Additional Multimedia Support
The Heart and Circulatory System - How They Work, By Mayo Clinic: https://www.sophia.org/tutorials/heart-ecg-ppg
Subscribe
Get the inside scoop on all things Teach Engineering such as new site features, curriculum updates, video releases, and more by signing up for our newsletter!More Curriculum Like This

Students use the engineering design process to build and refine a low-cost, light-based diagnostic prototype that simulates real-world biomedical tools. Students learn how light interacts with matter through spectrometry and explore how photonics technologies are used in point-of-care devices such a...

Students study how heart valves work and investigate how valves that become faulty over time can be replaced with advancements in engineering and technology. Learning about the flow of blood through the heart, students are able to fully understand how and why the heart is such a powerful organ in ou...

References
American College of Cardiology. Electrical System of the Heart. CardioSmart March 2012 https://www.cardiosmart.org/healthwise/te71/47ab/c/te7147abc. Accessed September 27, 2019.
Cheriyedath, Susha: Photoplethysmography (PPG) News Medical Net, February 2019. https://www.news-medical.net/health/Photoplethysmography-(PPG).aspx. Accessed September 27, 2019.
Euliano, T Y et al: Photoplethysmography and Heart Rate Variability for the Diagnosis of Preeclampsia. National Center for Biotechnology Information, U.S. National Library of Medicine. March 2018. https://www.ncbi.nlm.nih.gov/pubmed/28991110. Accessed September 27, 2019.
Fogoros, Richard N: What Is an Electrocardiogram (ECG)? What to expect when undergoing this test. October 2018. https://www.verywellhealth.com/the-electrocardiogram-ecg-1745304. Accessed September 27, 2019.
Hammond, Janelle K: Mathematics of Music. UW-L Journal of Undergraduate Research XIV (2011). https://www.uwlax.edu/urc/jur-online/pdf/2011/hammond.mth.pdf
Harvard Health Publishing. Harvard Medical School. Understanding the ECG: Reading the waves. February 2011.https://www.health.harvard.edu/heart-health/understanding-the-ecg-reading-the-waves. Accessed September 27, 2019.
Iowa Head and Neck Protocols: Pulse Oximetry Basic Principles and Interpretation. University of Iowa Healthcare. October 2017. https://medicine.uiowa.edu/iowaprotocols/pulse-oximetry-basic-principles-and-interpretation. Accessed September 27, 2019.
Silva, Joana: What are diastole and systole in blood pressure? Medical News Today, April 2018. https://www.medicalnewstoday.com/articles/321447.php Accessed September 27, 2019.
Alian, Aymen A: Photoplethysmography. Best Practice & Research Clinical Anesthesiology 28, 2014.
Elgendi, M: On Analysis of Fingertip Photoplethysmogram Signals. Current Cardiology Reviews 2012.
Elgendi, M et al: Toward Generating More Diagnostic Features from Photoplethysmography Waveforms, Diseases MDPI, 2018.
Millasseau, S et al: Determination of age-related increases in large artery stiffness by digital pulse contour analysis, Clinical Science 2002.
Takazawa, K et al: Assessment of Vasoactive Agents and vascular Aging by the Second Derivative of Photoplethysmogram Waveform. Hypertension 1998.
Demana-Waits-Foley-Kennedy-Bock: Precalculus Graphical, Numerical, Algebraic. Texas Edition Pearson 2015.
Hungeford-Jovell-Nayberry: Precalculus Graphing Approach, Holt-Rinehart-Winston, Harcourt Education Company 2006.
Larson, Ron – Edwards, Bruce: Calculus with CalcChat and CalcView. CENGAGE Learning 11e AP Edition.
Copyright
© 2019 by Regents of the University of Colorado; original © 2018 Rice UniversityContributors
Miguel R. Ramirez, Galena Park High SchoolSupporting Program
Precise Advanced Technology and Health Systems for Underserved Populations (PATHS-UP) Research Experience for Teachers, Rice Office of STEM Engagement and Department of Electrical and Computer Engineering, Rice UniversityAcknowledgements
This activity was developed as part of the Research Experience for Teachers through the Office of STEM Engagement and the Department of Electrical and Computer Engineering at Rice University supported by the National Science Foundation under grant number NSF EEC- 1648451. Any opinions, findings and conclusions or recommendations expressed in this material are those of the authors and do not necessarily reflect the views of the National Science Foundation.
Special thanks to Christina Crawford, RET Program Coordinator, Rice University, Tony Gardea, Galena Park High School Principal; Robert Derr, Galena Park High School Math Department Chair; and Michael McNeil, Galena Park High School Instructional Technology.
Last modified: August 8, 2025
User Comments & Tips