Quick Look
Grade Level: 11 (9-12)
Time Required: 45 minutes
Expendable Cost/Group: US $0.50 This activity also requires some non-expendable (reusable) lab supplies and equipment; see the Materials List for details.
Group Size: 4
Activity Dependency: None
Subject Areas: Physics
NGSS Performance Expectations:

| HS-ETS1-1 |
| HS-PS1-3 |
Summary
Students perform one of the first steps that environmental engineers do to determine water quality—sampling and analysis. Student teams measure the electrical conductivity of four water samples (deionized water, purified water, school tap water and a salt-water solution) using teacher-made LED-conductivity testers and commercially available electrical conductivity meters. They use multimeters to also measure the resistance of the samples. They graph their collected data to see the relationship between the conductivity and resistance. Then, all students measure the conductivity of tap water samples brought to school from their homes; they organize and average their data by sub areas within their local school district to see if house location has any relationship to the water conductivity in their community.Engineering Connection
Environmental engineers are challenged to find solutions to environmental problems related to water recycling, waste disposal, public health, and air and water pollution. Water pollution is a particularly important concern because ongoing access to supplies of clean water is essential in all communities. Engineers test the water quality as a first step in making plans to remediate any contamination problems. While several methods exist to determine if water is polluted or not, conductivity testing is one of the preliminary and simplest ways to measure water quality.
Learning Objectives
After this activity, students should be able to:
- Explain different ways to determine the conductivity of water.
- Determine the relationship between conductivity and resistance.
- Analyze water conductivity with respect to the water sample location.
- Propose a way to treat water so that its conductivity is in the acceptable range.
Educational Standards
Each TeachEngineering lesson or activity is correlated to one or more K-12 science,
technology, engineering or math (STEM) educational standards.
All 100,000+ K-12 STEM standards covered in TeachEngineering are collected, maintained and packaged by the Achievement Standards Network (ASN),
a project of D2L (www.achievementstandards.org).
In the ASN, standards are hierarchically structured: first by source; e.g., by state; within source by type; e.g., science or mathematics;
within type by subtype, then by grade, etc.
Each TeachEngineering lesson or activity is correlated to one or more K-12 science, technology, engineering or math (STEM) educational standards.
All 100,000+ K-12 STEM standards covered in TeachEngineering are collected, maintained and packaged by the Achievement Standards Network (ASN), a project of D2L (www.achievementstandards.org).
In the ASN, standards are hierarchically structured: first by source; e.g., by state; within source by type; e.g., science or mathematics; within type by subtype, then by grade, etc.
NGSS: Next Generation Science Standards - Science
| NGSS Performance Expectation | ||
|---|---|---|
|
HS-ETS1-1. Analyze a major global challenge to specify qualitative and quantitative criteria and constraints for solutions that account for societal needs and wants. (Grades 9 - 12) Do you agree with this alignment? |
||
| Click to view other curriculum aligned to this Performance Expectation | ||
| This activity focuses on the following Three Dimensional Learning aspects of NGSS: | ||
| Science & Engineering Practices | Disciplinary Core Ideas | Crosscutting Concepts |
| Analyze complex real-world problems by specifying criteria and constraints for successful solutions. Alignment agreement: | Criteria and constraints also include satisfying any requirements set by society, such as taking issues of risk mitigation into account, and they should be quantified to the extent possible and stated in such a way that one can tell if a given design meets them. Alignment agreement: Humanity faces major global challenges today, such as the need for supplies of clean water and food or for energy sources that minimize pollution, which can be addressed through engineering. These global challenges also may have manifestations in local communities.Alignment agreement: | New technologies can have deep impacts on society and the environment, including some that were not anticipated. Analysis of costs and benefits is a critical aspect of decisions about technology. Alignment agreement: |
| NGSS Performance Expectation | ||
|---|---|---|
|
HS-PS1-3. Plan and conduct an investigation to gather evidence to compare the structure of substances at the bulk scale to infer the strength of electrical forces between particles. (Grades 9 - 12) Do you agree with this alignment? |
||
| Click to view other curriculum aligned to this Performance Expectation | ||
| This activity focuses on the following Three Dimensional Learning aspects of NGSS: | ||
| Science & Engineering Practices | Disciplinary Core Ideas | Crosscutting Concepts |
| Plan and conduct an investigation individually and collaboratively to produce data to serve as the basis for evidence, and in the design: decide on types, how much, and accuracy of data needed to produce reliable measurements and consider limitations on the precision of the data (e.g., number of trials, cost, risk, time), and refine the design accordingly. Alignment agreement: | The structure and interactions of matter at the bulk scale are determined by electrical forces within and between atoms. Alignment agreement: | Different patterns may be observed at each of the scales at which a system is studied and can provide evidence for causality in explanations of phenomena. Alignment agreement: |
International Technology and Engineering Educators Association - Technology
-
Use various approaches to communicate processes and procedures for using, maintaining, and assessing technological products and systems.
(Grades
9 -
12)
More Details
Do you agree with this alignment?
-
Assess how similarities and differences among scientific, mathematical, engineering, and technological knowledge and skills contributed to the design of a product or system.
(Grades
9 -
12)
More Details
Do you agree with this alignment?
-
Synthesize data and analyze trends to make decisions about technological products, systems, or processes.
(Grades
9 -
12)
More Details
Do you agree with this alignment?
State Standards
Texas - Science
-
demonstrate the use of course apparatus, equipment, techniques, and procedures, including multimeters (current, voltage, resistance), triple beam balances, batteries, clamps, dynamics demonstration equipment, collision apparatus, data acquisition probes, discharge tubes with power supply (H, He, Ne, Ar), hand-held visual spectroscopes, hot plates, slotted and hooked lab masses, bar magnets, horseshoe magnets, plane mirrors, convex lenses, pendulum support, power supply, ring clamps, ring stands, stopwatches, trajectory apparatus, tuning forks, carbon paper, graph paper, magnetic compasses, polarized film, prisms, protractors, resistors, friction blocks, mini lamps (bulbs) and sockets, electrostatics kits, 90-degree rod clamps, metric rulers, spring scales, knife blade switches, Celsius thermometers, meter sticks, scientific calculators, graphing technology, computers, cathode ray tubes with horseshoe magnets, ballistic carts or equivalent, resonance tubes, spools of nylon thread or string, containers of iron filings, rolls of white craft paper, copper wire, Periodic Table, electromagnetic spectrum charts, slinky springs, wave motion ropes, and laser pointers;
(Grades
9 -
12)
More Details
Do you agree with this alignment?
-
organize and evaluate data and make inferences from data, including the use of tables, charts, and graphs;
(Grades
9 -
12)
More Details
Do you agree with this alignment?
-
express and interpret relationships symbolically in accordance with accepted theories to make predictions and solve problems mathematically, including problems requiring proportional reasoning and graphical vector addition.
(Grades
9 -
12)
More Details
Do you agree with this alignment?
-
characterize materials as conductors or insulators based on their electrical properties;
(Grades
9 -
12)
More Details
Do you agree with this alignment?
Materials List
Each group needs:
- 8 paper cups, to hold test samples of deionized water, purified water, school tap water, salt-water solution, and each student's sample of tap water brought from home
- ~400 ml deionized water (200 ml for test sample, 200 ml to make salt-water solution), such as chemical grade, 1 gallon bottle (CAS 7732-18-5) at http://www.sciencecompany.com/Deionized-Water-1-gal-P16280.aspx; some company and university research labs are willing to give teachers some deionized water for free
- ~200 ml purified water, such as 1 gallon bottle at grocery stores or Walmart
- ~200 ml school tap water
- ~2g salt and 200 ml deionized water (purified water works, too)
- ~200 ml sample tap water from home, per student
- LED-conductivity tester, such as the one in Figure 1-left, made by the teacher from 2 AA batteries in a battery holder with switch, breadboard and LED light, wire, alligator clips and electrical tape, mounted on sturdy cardboard; connect everything as shown on the Testing Equipment Setup Visual Aid (which also provides website sources for example materials)
- electrical conductivity meter, see Figure 1-middle, such as HM Digital AP-2 AquaPro Water Quality Electrical Conductivity Tester at https://www.amazon.com/HM-Digital-AP-2-Electrical-Conductivity/dp/B0038QTQZ8/ref=sr_1_3?ie=UTF8&qid=1392051994&sr=8-3&keywords=conductivity+tester
- multimeter (includes two test probes), see Figure 1-right
- a map of your local school district divided into ~5 distinct areas; see the Procedure section for details
- extra 200 ml purified water in cups or squirt bottles, for rinsing testing equipment between samples
- paper towels, for drying rinsed testing equipment
- Should I Drink That? Worksheet, one per person
- Lab Equipment Testing Instructions, one per group
- (optional) tray to hold the water samples in cups, to contain any spillage
- (optional) calculators, for calculating averages
To share with the entire class:
- sink and drain, for source of school tap water and disposal of water samples
- marker or tape and pen, for labeling cups to identify water samples
- (optional) capability to show students a four-minute online video
Worksheets and Attachments
Visit [www.teachengineering.org/activities/view/uoh_drinkthat_activity1] to print or download.Pre-Req Knowledge
Students should know how electricity is produced, how to plot a graph, and the definitions and basic concepts of resistance, current and voltage.
Introduction/Motivation
(Begin by asking the class some pre-activity discussion questions to assess their prior knowledge about electricity, resistance, electrical conductor materials, and high-resistance materials, as described in the Assessment section.)
(Divide the class into groups of four students each. Make sure groups have paper and pencils to record their brainstorming ideas. Present the challenge question to the class.)
Challenge Question: You are stranded on a deserted island with only a backpack of science instruments and tools. You are very thirsty and the only water source is the river on the island. Using some basic tests, how would you determine whether the water is safe to drink?
(Give students time to brainstorm and document all their ideas. Have each group share its answers and explain why. Gather all the ideas and summarize them on the classroom board. Expected possible answers: Examine the water by checking its color, turbidity, smell, pH and the surrounding environment. Watch to see if fish live in the water or animals drink it. If some students suggest tasting the water, let them know that this is not a smart idea since the water quality is unknown.)
These days, scientists and engineers use many ways check to see if water is safe for people to drink. One way is by measuring the electrical conductivity of the water. Let's learn more about this and see how it works. Then, in today's activity, you will perform one of the very first steps that environmental engineers do when faced with possible contaminated, polluted and possibly unsafe water to drink—sampling and analysis.
(Continue on to present students with background information on electrical conductivity and resistance as applies to the purity of water, before conducting the experimental portion of the activity.)
Procedure
Background Information for Students
(Before students start the activity, provide them with the following background information so they learn the relationship of electrical conductivity and resistance as it applies to gauging water purity. Show students a four-minute video that explains how conductivity is a preliminary test for water purity or view the video as teacher background information; see the website URL in the Additional Multimedia Support section.)
Conductivity is the ability of a material to conduct electricity. It is a reciprocal of resistivity. Resistance (SI unit is ohm, Ω) is the opposition of a material to the flow of electricity. (As necessary for your class, supplement with information/review about resistance, voltage, current and power.)
Pure water has no conductivity, so if water conducts electricity, it is an indication that impurities might be present in the water. Water conductivity is affected by the presence of: inorganic solids (such as chloride, nitrate, sulfate and phosphate anions or sodium, calcium, iron and aluminum cations) and organic compounds (such as oil, phenol, alcohol and sugar). Inorganic solids have high conductivity while organic compounds have very low conductivity in water. Conductivity is also affected by temperature: the higher the water temperature, the higher the conductivity. Because ionic activity increases with temperature, conductivity is usually reported at 25 °C for consistency across measurements.
The unit of measurement commonly used for conductivity is microsiemens per centimeter (μS/cm). If water has a high concentration, adjust the unit to millisiemens per centimeter (mS/cm) or siemens per centimeter (S/cm). Since conductivity is the reciprocal of resistance, siemens (S) is the inverse of ohm (Ω). In some textbooks, "mho" (ohm spelled backwards) is used instead of siemens.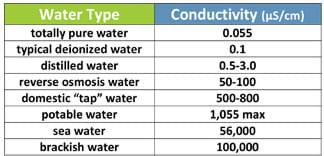
Table 1 provides the approximate conductivities of water from different sources (you may want to write this information on the classroom board). According to the U.S. Environmental Protection Agency, inland fresh waters with good mixed fisheries have conductivities that range between 150 and 500 μS/cm. Conductivities outside of this range might indicate that the water is not suitable for certain species of fish or macro invertebrates. For potable water, the maximum conductivity is 1,055 μS/cm; any higher conductivity might harm the people drinking or using the water for cooking. 
Engineers design, create and monitor all sorts of devices, appliances, engines, machines, processes, structures and public works (just a few examples). Before engineers design or invent something, they must understand the purpose of the design. For example, an environmental engineer may want to create a device to remove or minimize water pollutants. The first thing that s/he does is analyze what is in the water. S/he determines any problems with the water quality and the characteristics of any pollutants present in the water.
Keep in mind that conductivity is only a preliminary test to check the water purity. Other analytical tests, such as pH, salinity, total dissolved solids, etc., must be performed in order to determine if the water is polluted or not.
Before the Activity
- Gather materials and make copies of the Should I Drink That? Worksheet (one per student) and the Lab Equipment Testing Instructions (one per group).
- Prepare the three conductivity and resistance tester equipment setups for each group, as shown in Figure 1 and in the Testing Equipment Setup Visual Aid (larger versions of the Figure 1 photographs).
- Set up experiment stations around the room with water samples and testing equipment for each group. Provide paper towels and pure water for rinsing when using the equipment. Each group needs samples of deionized water, purified water, tap water and a salt-water solution, in labeled cups on a tray, with extra cups (one per student) for the tap water samples they bring from home. For the water samples, you may use less than 200 ml for each sample, but using ~200 ml tends to make the cups more stable during the testing procedures. As long as the meters and multimeter electrodes are submerged, you have enough.
- Prepare the salt-water solution with either deionized or purified water (it does not matter, since we are just checking the trend and not analyzing quantitatively) Prepare the salt solution depending on the range of the conductivity meter used; the suggested ratio worked well, but adjust as necessary. Whatever amount of salt you use, expect the salt-water solution to always result in the highest conductivity measurement.
- Find, prepare and print out local school district maps (or a large-enough area that all students' homes are included on the map) that you have prepared by dividing the region into about five areas, one marked-up district map per group or one larger one for the class. See Figure 2 for an example map. Some school district websites provide a map; if not, use Google Maps to create and print a suitable map that covers the area where all students live. Decide how to divide the map into area groups based on the number of students per class and the district size. Ideally, divide the district into relatively evenly sized sub areas that result in at least 4-5 students in a group. Since students live in these areas, have them provide the area descriptions to share with the class.
- Remind students to each bring about 200 ml (about 7 oz) of tap water from their homes to be tested.
- For Part 2, draw a blank class table on the classroom board titled, "Average electrical conductivity at different areas in the district," as shown in Table 2. Make enough rows to collect data from all students, organized by group area, so averages can be calculated for each group area.
With the Students: Pre-Lab Predictions
- After presenting students with the Introduction/Motivation content and additional background information, have student groups assemble at experiment stations. Hand out the worksheets.
- Tell the students: As we know, conductivity is the ability of materials to conduct electricity. Your group has four test samples: deionized water, purified water, tap water and a salt-water solution.
- Ask the students: Which of these different types of water samples do you think will have the highest conductivity? Give students a few minutes to think about it and write their predictions and explanations on their worksheets.
With the Students: Part 1. Measuring Electrical Conductivity of Different Liquids
- For Part 1, your group will test the electrical conductivity of the water samples using two methods: homemade LED-conductivity testers and commercially available electrical conductivity testers. Then you will use digital multimeters to measure resistance of those same samples.
- Hand out one testing instruction sheet to each group.
- Direct students to work in their groups to conduct the activity, guided by the worksheet and following the step-by-step instructions for using the three pieces of equipment (see Figure 1) to gather data.
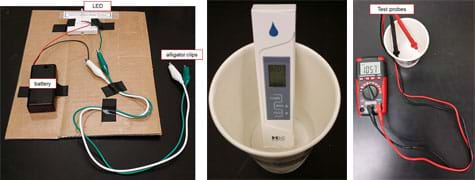
Figure 1. Equipment setups for determining the electrical conductivity of liquid samples using the LED-conductivity tester (left) and an electrical conductivity tester (middle), and measuring the resistance of the samples using a digital multimeter (right). - Once data is collected, direct students to answer the Part 1 data analysis questions. This includes graphing some of their data to show the relationship between resistance and electrical conductivity. Wait to move on to Part 2 until students are done with Part 1.
With the Students: Part 2. Electrical Conductivity of Community Tap Water Samples
- After students have learned in Part 1 how ions in water affect the conductivity and resistance measurement, they determine the conductivity of water samples brought from home.
- For Part 2, you will test the electrical conductivity of the tap water samples you brought from home. Follow the worksheet instructions.
- First, look at the school district map and find the location of your home (see Figure 2). Your home location tells you what group you are in. Record your group number on your worksheet. Get together with everyone in your group.
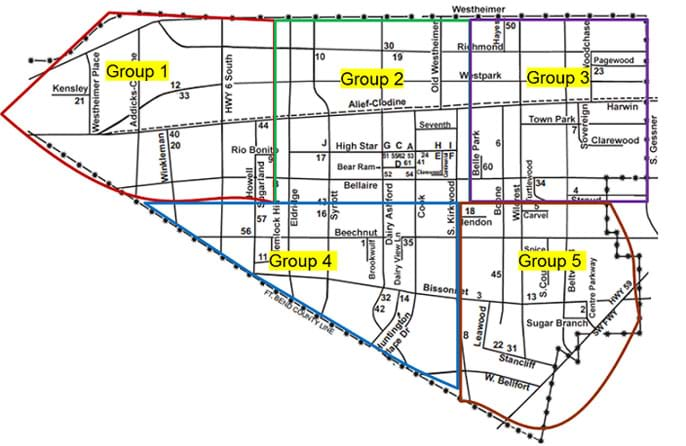
Figure 2. Example school district map divided into five regions to which students organize into groups based on the location of their homes (and tap water samples). Create a similar map using your school district area. - Then, make a prediction: Do you think the water in your group area will have the same electrical conductivity as the other group areas? Think about this. Talk about it with the others who live in the same group area. Then write down your prediction on your worksheet, including an explanation of your logic.
- Next, pour your tap water sample into a clean lab container (such as a paper cup) and measure the conductivity of your sample using the electrical conductivity tester, as you did in Part 1. Record on the worksheet your measurement.
- Then also record your measurement on the class data table on the classroom board (see Table 2.).

Table 2. Average electrical conductivity at different areas in the school district. For Part 2, draw this table on the classroom board to compile, average and compare class data. - With all the other members of your group area, think about and discuss your region of town (your group area according to the map). Describe your group area. Does it have parks, supermarkets, hospitals, schools, highways, restaurants, factories, etc.? Do you know—what is/are the tap water sources? Write your area description on your worksheet. Then agree on a summary area description and have one person write that on the class data table for your group area.
- When everyone is finished recording their measurements, calculate the average conductivity per area. Record this group area average on worksheet Table A and on the class table for your group area.
- Fill in worksheet Table B with the group area information and data from the class table.
- On your worksheets, rank the groups in order of increasing conductance.
- Direct students to analyze the class table results and reflect upon what they learned in the activity by writing a paragraph that includes the answers to four questions provided on the worksheet (and in the Assessment section).
- Conclude by leading a class discussion in which students share what they have written.
Vocabulary/Definitions
deionized water: Water that has had nearly all its mineral ions removed.
directly proportional: A relationship between two items such that one becomes larger when the other becomes larger, or one becomes smaller when the other becomes smaller.
electrical conductivity: The ability of a material to conduct electricity; measured in siemens per meter (S/m); inversely proportional to resistance.
inversely proportional: A relationship between two items such that one becomes larger when the other becomes smaller, or one becomes smaller when the other becomes larger.
ion: An atom or a molecule in which the number or electrons is not equal to the number of protons; an atom or molecule carrying a charge.
kilo (k): A unit prefix in the metric system denoting multiplication by 1,000.
micro (μ): A unit prefix meaning 1 millionth (10 to the power of minus 6). μ is mu.
ohm (Ω): The SI unit of electrical resistance, expressing the resistance in a circuit transmitting a current of 1 ampere when subjected to a potential difference of 1 volt.
purified water: Water that is mechanically filtered or processed to be cleaned for consumption
resistance: The opposition of a material to the flow of electricity; ratio of the voltage across the object to the current flowing through it; inversely proportional to electrical conductivity.
salt-water solution: Water mixed with salt.
siemens: The SI unit of conductance; equal to 1 reciprocal of ohm.
tap water: Water from a piped supply. In the U.S., usually assumed to mean municipal-supplied water that is safe for consumption.
Assessment
Pre-Activity Assessment
Discussion Questions: To assess students' prior knowledge about conductivity, give student pairs some time to discuss and agree upon answers to the following questions. After the allotted time, have groups share their answers with the rest of the class.
- What is electricity? (Example answers: Form of energy, flow of electrons.)
- Define resistance. (Example answer: The opposition of a material to electricity flow; the ratio of the voltage across the object to the current flowing through it; inversely proportional to electrical conductivity.)
- What is a conductor of electricity? (Example answer: An object or type of material that permits the flow of electrical current in one or more directions.)
- What are some examples of materials that have high resistance? (Example answers: Diamond, rubber, plastic, Styrofoam, ice, wood, glass, paper, concrete.)
- What are some examples of good conductors? (Example answer: Metals such as copper, aluminum, brass, nickel, iron, gold, silver.)
Activity Embedded Assessment
Worksheet: Have students complete the Should I Drink That? Worksheet during the course of the activity. Review their work—answers, data, graphs—to gauge their comprehension of the material and their participation during the activity.
Post-Activity Assessment
Written Analysis/Reflection: At activity end, have students write an analysis and lab reflection summary to describe what they have learned in the activity. Instructions are presented on the Should I Drink That? Worksheet as the Part 2 data analysis assignment: write a paragraph that includes answers to the following questions. Then lead a class discussion in which students share what they have written. Collect their worksheets in order to individually assess students' comprehension of the activity concepts. Refer to the Should I Drink That? Worksheet Example Answers, including key discussion points to make.
- What reasons might explain a high electrical conductivity for tap water?
- What are any differences in the conductivity readings among groups?
- Based on the results, what relationship exists between the type of area and the electrical conductivity of tap water?
- Thinking as an environmental engineer, what are ways to reduce the conductivity of tap water? Propose any design (or design improvement).
Safety Issues
Because the multimeter probe tips are pointed, watch that students are careful using them and not playing or running with them.
It helps to place each group's water samples in a tray to prevent spillage. Have paper towels available near students' experiment stations.
Troubleshooting Tips
For the resistance reading, have students record the data exactly 1 minute after the multimeter is submerged in the sample. They must be consistent with this procedure in order to get the expected trend.
Activity Scaling
For more advanced students, have them prepare their own salt-water solutions, LED-conductivity testers and multimeter testing setups (Figure 1-left and right).
Additional Multimedia Support
A good resource for a simple explanation of electricity is the About.com Inventors page on understanding electricity, titled "What is Electricity?" at http://inventors.about.com/library/inventors/blelectric1.htm.
A recommended background resource for students and teachers is a 4:19-minute video that explains how conductivity is a preliminary test for water purity, The Truth about Stuff in Water: Conductivity: An Initial Screening Tool: https://www.youtube.com/watch?v=wwGKFca65l0.
Subscribe
Get the inside scoop on all things Teach Engineering such as new site features, curriculum updates, video releases, and more by signing up for our newsletter!More Curriculum Like This

Students are introduced to the technology of flexible circuits, some applications and the photolithography fabrication process. They are challenged to determine if the fabrication process results in a change in the circuit dimensions since, as circuits get smaller and smaller (nano-circuits), this c...
Copyright
© 2014 by Regents of the University of Colorado; original © 2014 University of HoustonContributors
Marjorie HernandezSupporting Program
National Science Foundation GK-12 and Research Experience for Teachers (RET) Programs, University of HoustonAcknowledgements
This digital library content was developed by the University of Houston's College of Engineering under National Science Foundation GK-12 grant number DGE 0840889. However, these contents do not necessarily represent the policies of the NSF and you should not assume endorsement by the federal government.
Last modified: June 30, 2020


User Comments & Tips