
Quick Look
Grade Level: 7 (6-8)
Time Required: 1 hours 30 minutes
Expendable Cost/Group: US $0.00 (This activity examines data supplied from an experiment that measured the speed of sound from a sensor on a high-altitude balloon (which costs more than $500). However, the data is freely accessible to interpret.)
Group Size: 3
Activity Dependency: None
Subject Areas: Algebra, Earth and Space, Measurement, Physics
NGSS Performance Expectations:

| MS-PS4-1 |
| MS-PS4-2 |
| MS-PS4-3 |
Quick Look
- Grade Level:
- 7 (6 – 8)
- Time Required:
- 1 hours 30 minutes
- Group Size:
- 3
- Subject Areas:
-
Algebra Earth and Space Measurement Physics -
NGSS Performance Expectations:
MS-PS4-1 MS-PS4-2 MS-PS4-3

Summary
Understanding the layers of the atmosphere and their effects on aerospace designs helps engineers design explore the skies—and beyond! In this activity, students make sense of and use real world data to investigate a variety of phenomena including the speed of sound, waves, air pressure, humidity, and temperature at high altitude. Using data collected with payload sensors attached to a high-altitude balloon students examine, interpret, verify theoretical speed of sound equations. By graphing these data against other measurements such as air pressure, humidity, and temperature, students conclude that the speed of sound varies as a function of temperature, but not air pressure and humidity. Moreover, students determine that the speed of sound data loses accuracy at high altitude and low temperature, highlighting limitations of the data and challenges that engineers face when designing an experiment.Engineering Connection
To design aircraft, rockets, and sensors, an engineer must know the characteristics of the atmosphere where these devices operate. Properties such as temperature, pressure, and density depend on altitude. For example, two properties which determine how an aircraft wing will perform are density and speed of sound. These two characteristics also lead to design tradeoffs. Measuring how the speed of sound varies with altitude and what factors cause or contribute to its variation gives an engineer valuable design information. When engineers get information from measurements, they must critically examine the data to assure that it measures what they are trying to measure (also known as validity) and also determine its accuracy.
Learning Objectives
After this activity, students should be able to:
- Explain how sound functions and how to measure changes in the speed of sound.
- Describe changes in real-world data and how it affects design and graph relationships of independent and dependent variables.
- Verify a scientific claim by examining evidence of relationships of data (graphs).
Educational Standards
Each Teach Engineering lesson or activity is correlated to one or more K-12 science,
technology, engineering or math (STEM) educational standards.
All 100,000+ K-12 STEM standards covered in Teach Engineering are collected, maintained and packaged by the Achievement Standards Network (ASN),
a project of D2L (www.achievementstandards.org).
In the ASN, standards are hierarchically structured: first by source; e.g., by state; within source by type; e.g., science or mathematics;
within type by subtype, then by grade, etc.
Each Teach Engineering lesson or activity is correlated to one or more K-12 science, technology, engineering or math (STEM) educational standards.
All 100,000+ K-12 STEM standards covered in Teach Engineering are collected, maintained and packaged by the Achievement Standards Network (ASN), a project of D2L (www.achievementstandards.org).
In the ASN, standards are hierarchically structured: first by source; e.g., by state; within source by type; e.g., science or mathematics; within type by subtype, then by grade, etc.
NGSS: Next Generation Science Standards - Science
| NGSS Performance Expectation | ||
|---|---|---|
|
MS-PS4-1. Use mathematical representations to describe a simple model for waves that includes how the amplitude of a wave is related to the energy in a wave. (Grades 6 - 8) Do you agree with this alignment? |
||
| Click to view other curriculum aligned to this Performance Expectation | ||
| This activity focuses on the following Three Dimensional Learning aspects of NGSS: | ||
| Science & Engineering Practices | Disciplinary Core Ideas | Crosscutting Concepts |
| Use mathematical representations to describe and/or support scientific conclusions and design solutions. Alignment agreement: Science knowledge is based upon logical and conceptual connections between evidence and explanations.Alignment agreement: | A simple wave has a repeating pattern with a specific wavelength, frequency, and amplitude. Alignment agreement: | Graphs and charts can be used to identify patterns in data. Alignment agreement: |
| NGSS Performance Expectation | ||
|---|---|---|
|
MS-PS4-2. Develop and use a model to describe that waves are reflected, absorbed, or transmitted through various materials. (Grades 6 - 8) Do you agree with this alignment? |
||
| Click to view other curriculum aligned to this Performance Expectation | ||
| This activity focuses on the following Three Dimensional Learning aspects of NGSS: | ||
| Science & Engineering Practices | Disciplinary Core Ideas | Crosscutting Concepts |
| Develop and use a model to describe phenomena. Alignment agreement: | A sound wave needs a medium through which it is transmitted. Alignment agreement: When light shines on an object, it is reflected, absorbed, or transmitted through the object, depending on the object's material and the frequency (color) of the light.Alignment agreement: The path that light travels can be traced as straight lines, except at surfaces between different transparent materials (e.g., air and water, air and glass) where the light path bends.Alignment agreement: A wave model of light is useful for explaining brightness, color, and the frequency-dependent bending of light at a surface between media.Alignment agreement: However, because light can travel through space, it cannot be a matter wave, like sound or water waves.Alignment agreement: | Structures can be designed to serve particular functions by taking into account properties of different materials, and how materials can be shaped and used. Alignment agreement: |
| NGSS Performance Expectation | ||
|---|---|---|
|
MS-PS4-3. Integrate qualitative scientific and technical information to support the claim that digitized signals (sent as wave pulses) are a more reliable way to encode and transmit information. (Grades 6 - 8) Do you agree with this alignment? |
||
| Click to view other curriculum aligned to this Performance Expectation | ||
| This activity focuses on the following Three Dimensional Learning aspects of NGSS: | ||
| Science & Engineering Practices | Disciplinary Core Ideas | Crosscutting Concepts |
| Integrate qualitative scientific and technical information in written text with that contained in media and visual displays to clarify claims and findings. Alignment agreement: | Digitized signals (sent as wave pulses) are a more reliable way to encode and transmit information. Alignment agreement: | Structures can be designed to serve particular functions. Alignment agreement: Technologies extend the measurement, exploration, modeling, and computational capacity of scientific investigations.Alignment agreement: Advances in technology influence the progress of science and science has influenced advances in technology.Alignment agreement: |
Common Core State Standards - Math
-
Compute unit rates associated with ratios of fractions, including ratios of lengths, areas and other quantities measured in like or different units.
(Grade
7)
More Details
Do you agree with this alignment?
-
Understand that a function is a rule that assigns to each input exactly one output. The graph of a function is the set of ordered pairs consisting of an input and the corresponding output.
(Grade
8)
More Details
Do you agree with this alignment?
Materials List
Each group needs:
- poster paper (for graphing)
- colored markers
- rulers
- calculator
- laptop or computers with internet and access to NASA website: https://www.grc.nasa.gov/www/k-12/VirtualAero/BottleRocket/airplane/sound.html
To share with the entire class:
- data sheets from the 2019 LIFT PROJECT balloon launch (students calculate the theoretical speed of sound) for altitudes of 0-27 km:
- Air Pressure Data Sheet
- Humidity Data Sheet
- Temperature Data Sheet
- Speed of Sound Data Sheet
- For time management, each group could graph one relationship (such as speed of sound vs. air pressure, etc.) and then take on other graphing relationships if time permits
- photos / data plots
- Air Pressure Data Sheet Plot
- Humidity Data Sheet Plot
- Temperature Data Sheet Plot
- Speed of Sound Data Sheet Plot
- video: 2019 LIFT Project - Speed Of Sound: https://youtu.be/ZO-8rdrp348 (5:15)
Worksheets and Attachments
Visit [www.teachengineering.org/activities/view/uow-2585-speed-sound-altitude-activity] to print or download.Pre-Req Knowledge
Prior knowledge about properties of waves as well as prior knowledge about how to graph would benefit students. Students should be able to determine and label axes to graph data. If not, a quick review session is needed to ensure consistent graphs using the real-world data.
Introduction/Motivation
How fast does sound travel? On a cold day, does sound seem to travel faster? Can you hear better when it’s humid or when it’s dry? How do you produce a louder sound? If we could see sound, what would a louder sound look like compared to a quieter one?
If the sound was the same, would there be any difference in how you heard it that related to environmental factors, such as the weather? [These questions are meant to recall that a “louder” sound corresponds to a higher-amplitude wave if one were to graph this concept.]
Today we are going to investigate the speed of sound and what factors might influence the speed of sound.
Can anything cause the speed of sound to change? What about temperature? It’s very cold at high altitude, would that affect the speed of sound? What about humidity? What about air pressure? Air pressure decreases at higher altitudes. Will that affect the speed of sound?
Let’s start this activity by hypothesizing factors—humidity, air pressure, and temperature—and how they effect the speed of sound! Then, let’s dive into the data and see how we can visualize the effects of these atmosphere factors.
Procedure
Background
In 2019, the LIFT Project out of the University of Wyoming sent an experiment to high altitude with a large balloon. Their team first designed the payload by devising a way to answer our question about what physical attributes affect the speed of sound.
They designed and used additive manufacturing (3D printing) to create a device that transmits an ultrasonic signal at regular intervals (every 5 seconds) and measures how long it takes the signal to move across a fixed distance. Speed is distance divided by time, so the time it takes the signal to move across that fixed distance is directly related to the speed of sound.
They recorded the measurements onto a memory card in the payload, allowing us to analyze the data once the payload had completed its journey.


After releasing the balloon, the LIFT Project tracked it using a GPS transmitter attached to the balloon. It rose to over 27 km above sea level (~88,700 feet) and landed about 20 km (approximately 12.5 miles) away. The balloon expanded as it rose higher and eventually popped, allowing the payload equipment to fall back to earth. [Play Video: 2019 LIFT Project - Speed Of Sound: https://youtu.be/ZO-8rdrp348].
They obtained a log of the altitude, speed of sound, and various physical attributes from the sensor’s memory card. These data are included with this activity so that students can explore what affects the speed of sound—is it temperature, air pressure, humidity, or a combination of all three?
Note: since this is real data, it is not perfect! In fact, the speed of sound data provided in this activity were corrupted above an altitude of 9 km (~30,000 feet) above sea level. This was due to issues with the payload sensor not operating correctly in the extreme cold at that altitude. The most accurate speed of sound measurements were actually recorded between the ground at 2,000 m or 2km (~ 6,000 feet altitude) and about 6,000 m (18,000 feet) altitude. In this layer, the measured and theoretical speed of sound values were in best agreement. Above that, the performance of the speed of sound sensor began to decrease until the sensor failed at 9,000 m (~30,000 feet). While this is not ideal, the graphing exercises using the real (albeit limited) data provided here can still make for a useful classroom activity.
Because failure of a sensor can cause failure of an expensive experiment or mission, an extension engineering activity is to investigate sensor characteristics (see Extensions below).
Students can verify their results with the theoretical equation for the speed of sound, using information at the following NASA website: https://www.grc.nasa.gov/www/k-12/VirtualAero/BottleRocket/airplane/sound.html. The balloon measurements will verify that the equation is correct. As long as the medium that sound is traveling through (air) maintains a constant composition, the speed of sound is solely a function of the temperature of that medium. Air pressure and humidity are not a factor. Using the equation from the NASA website, the speed of sound equals the square root of the ratio of specific heats (γ; where γ is the Greek letter ”gamma”) multiplied by the gas constant (R) and the temperature (T) of the medium. In our atmosphere, γ and R are both constant, so we would expect changes in the speed of sound to be correlated with changes in air temperature alone.
However, if you were to compare the speed of sound on Earth with that on Mars, using the same temperature for each, the speed will differ. This is because the atmospheres (or the medium) of the two planets have different composition; Earth’s atmosphere is oxygen and nitrogen while Mars’s is mainly carbon dioxide. At the same temperature sound will always be slower on Mars.
With the Students
- Introduce speed of sound/wave concept by presenting the Introduction and Background sections.
- Brainstorm #1
- In groups, have students brainstorm every
- thing they know about sound and write each idea on a piece of paper.
- Collect the responses and write ideas on the board.
- Ask the students the following questions:
- How can we measure the speed of sound?
- What factors might affect the speed of sound?
- Ask/Research: Discuss ideas gathered during the brainstorm session, keeping two goals in mind:
- Students progress in their thinking towards measuring the speed of sound by using distance divided by time. Once students have described this equation, guide them towards designing an experiment to test this. We held distance and time steady, which then assumed that the speed of sound could only vary due to other, mainly physical, factors.
- Students brainstorm these physical factors such as temperature, humidity, distance, air pressure, weather—even wind.
- (Optional, but recommended) Provide a quick review on graphing; distribute graphing poster paper, markers, calculators, and rulers.
- Brainstorm #2
- Students brainstorm how to design a speed of sound experiment. Students should all have a good grasp that speed is distance divided by time. d = st
- Explain and/or review the components of an experiment.
- Design: Move students into groups to begin designing their actual experiment. These designs will be paper-based. One student in each group records everything that is discussed, to be reviewed later.
- The speed of sound could be measured with distance and time both varying, it is simpler to hold distance constant to measure how the time (time of flight) changes in relation to other (physical attribute) variables such as temperature, humidity, and so forth.
- Students may progress to devising ways to measure physical factors, some easy (such as temperature) and others less easy (such as air pressure).
- Circle the room and support students with work.
- Note: Since students cannot actually build their experiments, the next part of the activity has students plotting real data provided by the LIFT Project. Students can compare their design ideas to the elements of found within the following video: [Play Video: 2019 LIFT Project - Speed Of Sound: https://youtu.be/ZO-8rdrp348].
- Before students begin plotting, the teacher and students can model one set of variables on the board: temperature vs. speed of sound. Using the data, determine axes and plot points:
- Students are given graph paper, colored markers, and points to plot for various variables. (One point per contribution to the variables on the board, one point for plotting, one point for axes labeled.) Students may be divided into groups and plot one graph each group.
- Overall three graphs should be created: one plotting speed of sound against temperature; one plotting speed of sound against humidity; and one plotting speed of sound against air pressure.
- Once students have finished plotting, have them discuss with their peers which variables affect the speed of sound and whether their hypothesis was correct.
- Plug these data into the Speed of Sound Calculator (https://www.grc.nasa.gov/www/k-12/VirtualAero/BottleRocket/airplane/sound.html) to calculate the speed of sound at each altitude. Compare results for Earth and Mars. Have students discuss why the results are different for Earth and Mars in their groups, then share out as a whole class.
- Students can then compare the measured speed of sound (from the LIFT Project experiment) with the speed of sound values that were calculated on a computer.
- The Speed of Sound + Theory Data Sheet Plot markedly departs from the actual speed of sound at a certain altitude. Students should analyze the temperature at that altitude, and offer a hypothesis that the sensor failed at low temperatures. This is what the LIFT Project team determined as the reason why data corrupted at a certain height. Other possibilities may be discussed, but should have evidence to back up claims, e.g., analyzing the physical attribute graphs to find patterns. One point for discussion, one point for backing up claims with evidence.
Vocabulary/Definitions
air pressure: The weight of the overlying atmosphere per unit area. At sea level, air pressure is described as 1 atmosphere (atm). High altitudes have less air pressure, while air pressure increases below sea level.
experiment: A designed test of a hypothesis, which can be performed through simple observations or through a more sophisticated test using a control and a test group.
high-altitude: A measured height from sea level, above the normal atmosphere from where most humans live on the ground. For example, the highest point on Earth, Mt. Everest, is 29,032 ft and does not offer a suitable environment for humans to live. The data from this project was measured at 50,000 ft above sea level into the atmosphere.
payload: The object or the entity which is being carried by an aircraft or launch vehicle, such as a GPS locator or sensors that take measurements on a weather balloon.
sound: Vibrations that travel through the air or another medium and can be heard when they reach a person's or animal's ear.
speed of sound: The distance travelled per unit of time by a sound wave as it propagates through an elastic medium.
wave: A propagating dynamic disturbance (change from equilibrium) of one or more quantities; an oscillation, disturbance, or alternating signal emitted from a source in a medium with a direction of travel— with different frequencies and amplitudes.
Assessment
Pre-Activity Assessment
Snowball Fight: In groups, students brainstorm everything they know about sound. Write ideas on a piece of paper. Crumple the paper and throw it at the instructor (aka “snowball fight”), who will write the ideas on the board.
Activity Embedded (Formative) Assessment
Discussion: How could you improve your experimental design? Is your experiment design able to capture the data you need? Review qualitative vs. quantitative measurement. Qualitative—subjective, might introduce more variables. Quantitative—need instruments, need to display and analyze data clearly in order to communicate findings to others. Teaser: Students use a quantitative approach to measure the speed of sound at altitude. Show a picture of the tallest part of the school (or other close place) and ask students how they could measure to the top of the school or the tallest building in the nearest large city.
Post-Activity (Summative) Assessment
Graphing Skills, Cooperation Skills: Can each group intelligently discuss the speed of sound and waves? Did each group produce a legible and reasonable graph? Were axes and data points plotted and labeled correctly?
Note: The following “answer key” can be used by teachers as a guide for steering discussion and assessing the activity:
- How can we measure the speed of sound? (Speed of sound is measured by distance divided by time. If we hold distance and time constant by sending a signal a fixed distance at a fixed interval of time, we can determine the speed of sound. If all else remains equal, the speed should not change. However, the device measuring the speed of sound is gaining altitude, which changes the temperature, air pressure, and humidity. Therefore, if we get different speeds, we can analyze the other data to determine which physical attribute caused the speed to change.)
- What factors might affect the speed of sound? (According to the equation on the NASA website, only temperature affects the speed of sound. This should be graphically “proven” by comparing plots and concluding that the air pressure and humidity graphs don’t show a relationship to the speed of sound. Only the temperature graph suggests a relationship, thus empirically “proving” the equation is valid.)
- What kinds of things should students come up with during the brainstorming to design a speed of sound experiment? (The crucial experiment is to measure the speed of sound and realize this can be done by holding the distance and the time constant, which makes any variation due to other factors. Measuring temperature, air pressure, and humidity may vary but must include sending a sensor as part of the payload.)
- What are the different components of such an experiment? (Mention should be made of variables both fixed (altitude) and not fixed (temperature, etc.) and how to fix a variable such as holding the distance steady (we used a 3D printed device with a constant distance to bounce sound signals off of) and time (we programmed the device to emit sound waves at a fixed time interval).)
- What variables should the students come up with? How do those variables affect the speed of sound? (Students may initially think of many variables, but plotting the graph should clarify that only the temperature makes a difference. Some variables students may posit that we did not measure include wind (we had the payload inside a Styrofoam box and thus shielded from the wind), sunlight (that will affect temperature), and weather (rain/snow will affect humidity).
- Explain why the results are different for Earth and Mars. (The speed of sound will vary on Mars because Mars has a different atmospheric composition. Thus sound waves will move through a different medium and therefore have a different speed than on Earth.)
Investigating Questions
Is sound a wave? What factors affect the speed of sound? What should wave data look like? What does this data tell us? What do we expect this data to look like? Are we surprised, and if so what might have caused any surprises? Does our data match our expectations? What could have led to differences? Why is it important to check our calculations?
Safety Issues
No safety issues outside of normal classroom activities.
Troubleshooting Tips
Consider a pre-activity on unit conversions or a review during the activity to make sure units are consistent. An important note is that the data starts at an altitude of ~2000 m above sea level because the LIFT Project experiment was launched from that altitude above sea level.
Activity Extensions
Suggested extensions: research high-altitude planes, drones, and other aircraft. What considerations need to be made when designing aircraft for high-altitude flight? Research atmosphere on Mars. What differences in physical attributes (e.g., temperature) would result in a difference in the speed of sound?
An important part of engineering design is anticipating problems early in the design and development sequence. In this particular case an ultrasonic distance sensor failed, and this indicates it may have been a poor choice for the instrument. Students can investigate this by first going to the “cut sheet” for the sensor at https://cdn.sparkfun.com/datasheets/Sensors/Proximity/HCSR04.pdf. They will see what the sensor looks like, but also will see that it provides no information on the range of temperatures or pressures over which the sensor works properly. However, a suggestion might be made that the main components of this sensor are an ultrasonic transmitter/receiver pair. The “cut sheet” for these devices is found at https://www.farnell.com/datasheets/3109335.pdf. Students will note that the operating temperature range is –30°C to 80°C. Since the atmosphere is colder than -30°C at high elevations, this sensor may have been a bad choice for the instrument. Investigate the measured air temperature during the flight by looking at the Temperature vs. Speed of Sound Plot. Note that –30°C is reached at just about 9,000 m altitude!
As an extension, students can investigate possible reasons for the failure of the ultrasonic sensor used in this experiment above 30,000 feet.
Activity Scaling
- For lower grades, prepare the graphs with axes ahead of class.
- For upper grades, expand into engineering trade-off decisions and analysis of failure—why did the instruments fail at 10,000 meters altitude? (Hint: temperature).
Subscribe
Get the inside scoop on all things Teach Engineering such as new site features, curriculum updates, video releases, and more by signing up for our newsletter!More Curriculum Like This

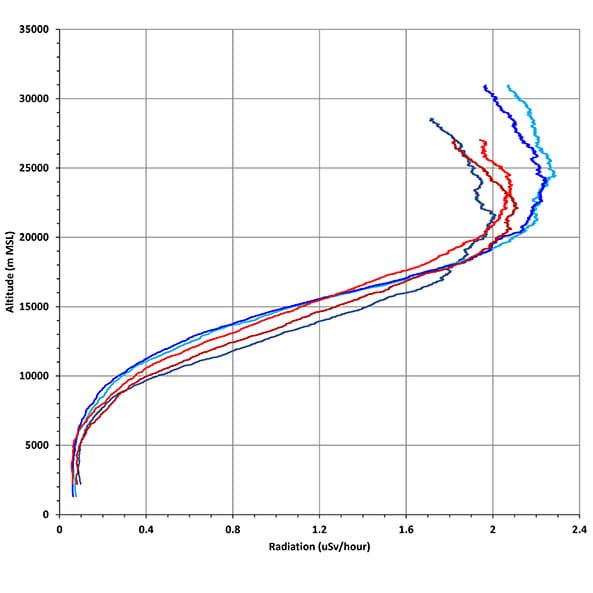
Students analyze radiation data collected from a balloon launched into near space to see if their designed cosmic radiation shielding worked. Students should explain their findings, which might require some research to show if this observation is correct and why. This includes a comparison of the s...
Students use a sponge and water model to explore the concept of relative humidity and create a percent scale. Through this experiment, teams collect data, make calculations and draw conclusions.

Through role playing and problem solving, this lesson sets the stage for a friendly competition between groups to design and build a shielding device to protect humans traveling in space. The instructor asks students—how might we design radiation shielding for space travel?
Students are introduced to air masses, with an emphasis on the differences between and characteristics of high- versus low-pressure air systems. Students explore actual data by comparing maps of high- and low-pressure air masses to radar data showing where weather is occurring

References
National Aeronautics and Space Administration. Last modified March 23, 2018. Accessed December 3, 2020. (Source of background information and equation used to calculate the theoretical speed of sound during the activity) https://www.grc.nasa.gov/www/k-12/airplane/sound.html.
Copyright
© 2022 by Regents of the University of Colorado; original © 2019 University of WyomingContributors
Tyra Relaford; Jacob Plowman; Joshua Crips; Trina Kilty; Philip Bergmaier; Shawna McBride; Kevin Kilty; Andrea Burrows; Kate Welsh; Andy Pannell; Teresa Strube; Theresa WilliamsSupporting Program
Learning to Integrate Fundamentals through Teaching (LIFT) Project, University of WyomingAcknowledgements
This material is based upon work supported by the National Science Foundation under grant No.1821566—Combining Project-based Learning, Citizen Science, and Authentic Research to Enhance the Success of STEM and STEM Education Majors at the University of Wyoming, Any opinions, findings, and conclusions, or recommendations expressed in this material are those of the authors and do not necessarily reflect the views of the National Science Foundation.
Last modified: April 29, 2022
User Comments & Tips