
Quick Look
Grade Level: 11 (10-12)
Time Required: 1 hour
Expendable Cost/Group: US $10.00
Group Size: 3
Activity Dependency: None
Subject Areas: Biology, Chemistry, Earth and Space, Science and Technology

Summary
The flow rate of a stream is the amount of water that passes a given point at any given time. The flow rate is a phenomenon that changes due to factors including, but not limited to, heavy rainfall, drought, or the collapse of watershed infrastructure, such as a dam. Therefore, the flow rate is a value that is measured on a continual basis. This monitoring is important for predicting flood conditions, monitoring water quality, managing and allocating water, and for recreational and safety purposes. In this activity, students explore their local stream by using a simple method to measure and calculate the flow rate of that stream. They compare their flow rate calculations measured to the peak flow rate and low flow rates found on the USGS StreamStats site for that location. Students then analyze their methods for measuring flow rate, discuss events that cause flow rates to change, and look at implications of increasing flow rates due to more frequent flood events.Engineering Connection
Civil engineers work with the planning, design, construction, and maintenance of structures that serve society, such as roads, highways, bridges, canals, dams, airports, sewage systems, power plants, pipelines, structural components of buildings, and railways. For many of these structures, civil engineers need to understand the local watershed, this includes understanding the flow rates of creeks, streams, and rivers within the watershed. The flow of water in a waterway (for example, in a stream) is directly related to the amount of water moving from the watershed into the stream. The flow rate is affected by weather and can change after major weather events, seasonally and due to human made changes. Knowing a stream’s peak and low flow rates are necessary to predict flooding, monitor impacts of pollutants and sediment, and to know the quantity of water available in a stream.
A special subfield of civil engineering is river engineering which studies human intervention in a river’s path, characteristics or flow to gain some benefit for humans. These benefits may be to protect an area from floods, to increase an area’s irrigation, to manage an area’s water resources, or to make movement along or across rivers easier. In addition, rivers have been engineered to be used as a source of hydropower.
Learning Objectives
After this activity, students should be able to:
- Calculate the flow rate of a stream.
- Understand that weather and seasonal factors can cause the flow rate to increase or decrease.
- Reflect on how infrastructure and public policies and decisions need to be based on stream flow rates.
Educational Standards
Each Teach Engineering lesson or activity is correlated to one or more K-12 science,
technology, engineering or math (STEM) educational standards.
All 100,000+ K-12 STEM standards covered in Teach Engineering are collected, maintained and packaged by the Achievement Standards Network (ASN),
a project of D2L (www.achievementstandards.org).
In the ASN, standards are hierarchically structured: first by source; e.g., by state; within source by type; e.g., science or mathematics;
within type by subtype, then by grade, etc.
Each Teach Engineering lesson or activity is correlated to one or more K-12 science, technology, engineering or math (STEM) educational standards.
All 100,000+ K-12 STEM standards covered in Teach Engineering are collected, maintained and packaged by the Achievement Standards Network (ASN), a project of D2L (www.achievementstandards.org).
In the ASN, standards are hierarchically structured: first by source; e.g., by state; within source by type; e.g., science or mathematics; within type by subtype, then by grade, etc.
NGSS: Next Generation Science Standards - Science
-
SEP.1.9-12.1.
Analyze data using tools, technologies, and/or models (e.g., computational, mathematical) in order to make valid and reliable scientific claims or determine an optimal design solution.
(Grades 9 - 12)
More Details
Do you agree with this alignment?
-
SEP.12.9-12.5.
Use mathematical and/or computational representations of phenomena or design solutions to support explanations.
(Grades 9 - 12)
More Details
Do you agree with this alignment?
International Technology and Engineering Educators Association - Technology
-
With the aid of technology, various aspects of the environment can be monitored to provide information for decision-making.
(Grades
9 -
12)
More Details
Do you agree with this alignment?
State Standards
Virginia - Science
-
volume, area, mass, elapsed time, direction, temperature, pressure, distance, density, and changes in elevation/depth are calculated utilizing the most appropriate tools;
(Grades
9 -
12)
More Details
Do you agree with this alignment?
-
The student will investigate and understand how freshwater resources are influenced by geologic processes and the activities of humans. Key concepts include
(Grades
9 -
12)
More Details
Do you agree with this alignment?
Materials List
Each group needs:
- a small object that floats (empty bottle, ball, rubber duck, orange, etc.)
- meter/yard stick
- stopwatch or timer
- waterproof tape measure (open reel fiberglass tape measures work well)
- clipboard (to hold data sheet)
- fishing waders or tall boots for any student getting in the stream (optional)
- Vernier flow rate sensor, available online (optional)
- Flow Rate Activity Worksheet
To share with the entire class:
- a local stream to where students can take measurements
- transportation to a local stream
- computer with internet access and projector
Worksheets and Attachments
Visit [www.teachengineering.org/activities/view/vpi-2603-exploring-flow-rate-activity] to print or download.Introduction/Motivation
Think about the following questions: Do you know how much water is flowing in your stream? (Possible answers: no, or vague answers) Do you think that amount of water flowing in the stream changes throughout the year? What events do you think causes it to change? (Answers might include rain, drought, irrigation, etc.) Can you think why it might be important to know this value? Please share your ideas with your partner. Can you share your thoughts with the class? (Possible answers: to manage flooding, to manage/distribute downstream agriculture irrigation, to regulate drinking water, and/or to build infrastructure.)
The amount of water in a stream changes throughout the year due to weather events such as flooding and droughts and due to manmade events such as irrigation and dams. Engineers measure this amount and how it changes to help prevent flooding, to monitor pollution, and to know the availability of water from that stream. The value they measure is called the flow rate. This value is represented with the letter Q and can be measured in ft3/s or m3/s. It is the amount of water that passes through an area in a specific amount of time.
We are going to measure this value for our stream. To do this, we are going to be going into the stream to take some measurements. Then we will come back to the classroom, to use our measurements to calculate the flow rate value. Finally, we will use the USGS StreamStats site to figure out what our value means by comparing it to peak and low flow rate values of our stream.
Procedure
Background
Flow rate (also known as discharge) is the volume of fluid which flows through the cross section of a stream per unit time. It is often measured by engineers to predict flooding or monitor pollution. The equation for flow rate (Q) is the stream velocity (V) times the stream area (A): Q = VA. Flow rate is reported in m3/s or ft3/s, but the USGS StreamStats values are measured in ft3/s, so in this activity measurements use these values as well.
“A” in the equation is the area of the stream. Area is calculated by multiplying the depth of the stream by the width of the stream. Streams are not uniform so multiple measurements would give a better representation of the true area of the stream, but due to time constraints and simplicity of the activity, only one value will be calculated.
Velocity varies throughout the stream bed. It is typically faster on the surface than on the bottom due to less friction from rocks, etc. It can also vary due to turbulence and other factors. The best representation of velocity would come from many measurements at different depths. In this activity, we will measure the surface velocity by measuring the time it takes for an object to float from point A to point B on the surface of the stream. The distance in feet from point A to point B will be divided by time in seconds. This will give a surface velocity that will be multiplied by 0.85 which is a constant often used to adjust the surface velocity to be more representative of the stream. It is important to discuss the limitations of measuring area and velocity with the students, so they understand the complexities of determining flow rate.
Because flow rate is the velocity times the area, it should be the same, no matter what part of the stream you measure. For example, if the velocity is greater, this is usually in a narrower part of the stream so the area will be lower. Hence, the flow rate remains the same in all parts of the stream. Where the velocity is slower the width is greater, and vice versa. The USGS StreamStats site has flow rate values for most streams in the US. This is useful for connecting students with reference values for the stream that they are working on and for helping them to understand that these values change.
Extra information: At the LEWAS (Learning Enhanced Watershed Assessment System) Lab at the Virginia Tech (http://lewas.ictas.vt.edu/), they have a continuous water monitoring system in place with flow rate being one of the parameters they measure. The following explains the method they use to measure flow rate:
The Learning Enhanced Watershed Assessment System (LEWAS) uses two instruments to measure flow rate. The first instrument, an Acoustic Doppler Current Profiler (ADCP) or flowmeter on the stream bed transmits short pulses of sound in three directions. The narrow beams of sound reflect off small particles moving in the water before being received by the ADCP. The difference in transmitted and received frequencies are used to measure velocity in the stream. The cross-sectional area of the stream is then used to calculate the discharge or flow rate. The second instrument, an Ultrasonic Level Transducer (ULT) on the ceiling within the large box culvert, transmits a similar beam in only one direction straight down to the water's surface. The beam reflects off the surface back to the ULT measuring the stage height of the water behind the weir. The stage height is used in a weir equation to calculate flow rate.
Before the Activity
- Find a local stream that is fairly straight, can be safely accessed, and allows students to safely stand in the water.
With the Students
- Travel to the stream.
- Go over any safety issues before heading to the stream.
- Students must wear protective shoes in stream.
- Students wash hands and wash off any cuts after leaving the stream.
- Divide the class into groups of 4. (One person at point A in the stream and one at point B in the stream. One person will time, and one will write down the data.)
At the stream, taking measurements:
- Have each group choose a fairly straight section of the stream that they can stand in and be able to float an object down without it getting stuck in debris. (If there is only one good location, groups can take turns taking their measurements.)
- For each group of 4, two students will need to be in the stream to take measurements and to float the object. Two students will need to stand on the bank, one with a timer and one ready to record the data (see Flow Rate Activity Worksheet attached).
- Using the waterproof tape measure, have the two students in the water measure the length (l) in ft of that section of the stream. Record measurement on data sheet.
- Using the waterproof tape measure, have the two students measure the width (w) in ft of that section of the stream. Choose the width that best represents that section of the stream. Record measurement on data sheet.
- Using the yard stick, have the two students in the water measure the depth (d) of the stream in feet by placing the yard stick on the bottom of the stream in the deepest part of the selected area. Record measurement on data sheet.
- Have one student stand on the bank of the stream with a timer ready to time in seconds (s) how long it takes for the floatable object to go from one end of the measured area to the other.
- Have the student upstream (point A) place the floatable object in the stream at the beginning of the measured area.
- Have the student downstream (point B) catch the floatable object at the end of the measured area.
- Record time measurement on Flow Rate Activity Worksheet.


In the classroom, calculate the flow rate (Q):
- Ask students to calculate the cross-sectional area (A) of their section of the stream. [Answer: Area is found by multiplying the width (w) by the depth (d) of the stream.] Record on data sheet.
- Have students calculate the velocity of the surface (Vsurface) for their section of the stream. [Answer: Vsurface is found by dividing the length (l) of that section of the stream by the time in seconds (s) it took the bottle to float.] Record on data sheet.
- Have students determine the mean velocity (Vmean) of their section of the stream. (Answer: Multiply Vsurface by the value 0.85; this value is one type of constant used to adjust for the fact that the velocity at the surface is faster than velocity deeper in the water.)
- Finally, have the students calculate the flow rate (Q) of their section of the river. [Answer: Multiply the area (A) by the mean velocity (Vmean). Their answer should be in ft3/s.]
- Ask the students: Was this the most accurate way to determine the flow rate? What would you improve/change to get the most accurate flow rate? (Answer: It would be more accurate if multiple measurements were taken. The depth and width of the stream changes, so it would be better to measure the flow rate in multiple locations and then average the measurements. Also, the velocity changes throughout the stream, so more than one measurement can help to adjust for these variations.) Let the students know that in the field there are more expensive instruments (ex: SonTek Flow Tracker), that also help engineers calculate a more precise flow rate.
Equation Summary: Q = VA =(0.85s)(wd)
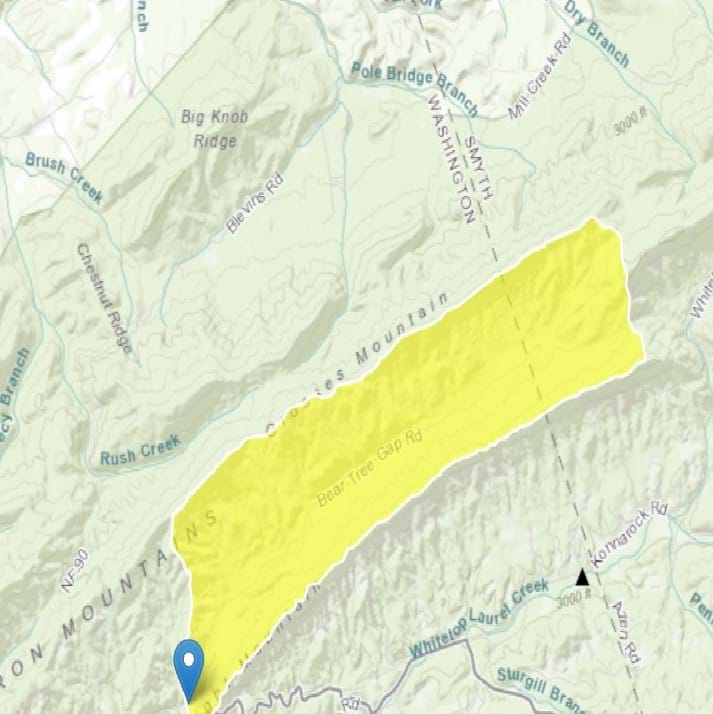
In the classroom, using USGS StreamStats:
- On the computer, have students go to https://streamstats.usgs.gov/ss/
- Have students find the watershed for the stream they made their measurements in.
- Type in location to zoom into the map.
- Click the state or region of study.
- Zoom into the stream.
- Click the delineation button and click on a spot on your creek.
- Wait for the application to delineate the watershed. Choose the blue continue button on the left-hand side of the screen.

- Next have students click on the peak flow statistics and low flow statistics buttons. (They can choose other basin characteristics that they are interested in as well.) Click continue. The program will now build a report.
- On the report, scroll down to see the peak flood values and the range for low flow.
- Ask students how their value compares. Was it flooding when they took their measurements? Drought?
- Compare the 200-year peak flood (rain events with a 0.5 % chance of occurring) to the 2 -year peak flood values (rain events with a 50% chance of occurring).
- Ask students, if they think different infrastructures would need to be in place to accommodate the greater volume of water for the 200- year peak flood?
- Tell students: With changing climates, we are seeing rainfall events with the 200- year peak values occur more frequently. In some places infrastructure that was put in place to protect flooding that was sufficient in the past is no longer sufficient and we are seeing widespread damage from flooding
- Show students the following video (1:31) of flash flooding in Washington, DC that has not occurred before: https://www.youtube.com/watch?v=4eUCAsHHIls
- Have students reflect on ways to address issues. (Potential answers: moving people out of floodplains, better stormwater management, maintaining existing wetlands, etc.)
- Have students reflect on who should be responsible for paying for damage or changes in infrastructure when these big rain events occur. (Potential ideas: Flood insurance, neighborhoods, taxes. Note: There will not be a single right answer but a reflection on public policy and decision making to help students to begin reflecting on important issues and how engineers, policy makers, communities and individual citizens can work to solve them.)
Vocabulary/Definitions
flow rate: Volume of fluid which passes per unit time (also known as “discharge”).
peak flow rate: Maximum instantaneous flow from a given storm condition at a particular location.
Assessment
Pre-Activity Assessment
Think-pair-share: Ask students to think about how much water is in their stream? Does that amount of water change throughout the year? Can they think why it might be important to know this value? Have them share with their partner and then with the class.
Activity Embedded (Formative) Assessment
The Flow Rate Activity Worksheet: See the calculation section on the Flow Rate Activity Worksheet. Check student measurements as they are taking them at the site. Check calculations back in the classroom.
Post-Activity (Summative) Assessment
Analysis: See analysis questions on the Flow Rate Activity Worksheet. Discuss what limitations students may have had taking the measurements and how that might impact their overall calculations. What are ways to make this more accurate? (More measurements to determine area more accurately. Repeat measurements.) How do the students' values compare to peak flow rates on the USGS StreamStats site? (Probably lower because you would not be doing this activity during a heavy rain event.) Have students think about ways engineers would have to plan for these higher flow rates and why they would need to (Prevent flooding of roads nearby. Maintaining wetlands to slow the rapid increase in flow rate during a big rain event….). If doing this activity as part of the larger unit “Hydrology: Assessing the Quantity, Quality and Availability of Water”, the students would show their data and calculations in their final PowerPoint presentation for the unit.
Safety Issues
- Carefully choose the stream location and inspect it yourself before the activity.
- Make sure that flow rate conditions have not changed or are changing due to a storm event
- Make sure there are no dangerous places immediately upstream and downstream of where you will conduct the activity.
- Remember that greater flow rate will decrease the safe depth that students may be wading into.
- Have students wear protective shoes in stream.
- Have students wash hands and wash off any cuts after leaving the stream.
Troubleshooting Tips
- Carefully choose the stream location that has a fairly straight section in which students can stand and in which the students will be able to float an object down without it getting stuck in debris.
Activity Extensions
This activity may be repeated before a rainfall and after a rainfall to see the changes in flow rate. A Vernier Flow Rate sensor may be used to show how the velocity changes throughout the stream. This flow rate sensor measures velocity. The area would still need to be measured for each location in the stream but it does introduce students to a fairly affordable piece of technology that could improve their values.
Activity Scaling
For younger grades, have adults take the stream measurements while the students watch.
Subscribe
Get the inside scoop on all things Teach Engineering such as new site features, curriculum updates, video releases, and more by signing up for our newsletter!More Curriculum Like This

Students learn about the water cycle and its key components. They learn how we can use the theory of conservation of mass to estimate the amount of water that enters a watershed (precipitation, groundwater flowing in) and exits a watershed (evaporation, runoff, groundwater out).

Students examine in detail the water cycle components and phase transitions, and then learn how water moves through the human-made urban environment. Students show their understanding of the process by writing a description of the path of a water droplet through the urban water cycle, from the dropl...

Understanding watersheds can help engineers design systems that deliver or protect key sources of water. In this activity, students become civil engineers as they use topographic maps to delineate watersheds. Watersheds show the path water travels over land in a particular area on its way to a river...
Students are introduced to innovative stormwater management strategies that are being used to restore the hydrology and water quality of urbanized areas to pre-development conditions. A PowerPoint® presentation provides photographic examples, and a companion file gives students the opportunity to sk...

References
McCormick, John. “Now on higher ground, ex-river town thriving.” Chicago Tribune. July 7, 2003. https://www.chicagotribune.com/news/ct-xpm-2003-07-07-0307070177-story.html.
“Watch: Residents of DC Area Capture Extent of Flash Flooding on Camera.” NBC News. July 8, 2019. https://www.youtube.com/watch?v=4eUCAsHHIls
Copyright
© 2021 by Regents of the University of Colorado; original © 2018 Virginia Polytechnic Institute and State UniversityContributors
Rachelle Rasco; Thomas Westfall; Dylan HonardoustSupporting Program
RET Water EcubeG Program, Virginia TechAcknowledgements
The work was supported by the Learning Enhanced Watershed Assessment System (LEWAS) Lab at Virginia Tech, which was funded by support of the National Science Foundation through grant no. 1609089—RET Site: EcubeG Program. Any opinions, findings, and conclusions or recommendations expressed in this paper are those of the author(s) and do not necessarily reflect the views of the National Science Foundation.
Last modified: April 7, 2022
User Comments & Tips