Quick Look
Grade Level: 8 (6-8)
Time Required: 15 minutes
Lesson Dependency: None
Subject Areas: Earth and Space, Science and Technology
NGSS Performance Expectations:

| MS-ESS2-5 |

Summary
Students learn that wind and storms can form at the boundaries of interacting high and low pressure air masses. They learn the distinguishing features of the four main types of weather fronts (warm fronts, cold fronts, stationary fronts and occluded fronts) and how these fronts are depicted on a surface weather analysis, or weather map. Students also learn several different ways that engineers help with storm prediction, analysis and protection.Engineering Connection
Engineers not only design weather forecasting instruments and software to predict a future storm, but they help protect people during a storm. Engineering is essential to our safety during a storm, through the design of sturdy buildings and structures, the development of processes for flying or driving through a storm, and the design of storm warning systems to alert people to oncoming threats. Engineers work on ways to develop and incorporate new technologies for more accurate predictions of the weather, and extreme weather, so we can make informed decisions about how we interact with our world.
Learning Objectives
After this lesson, students should be able to:
- Describe several weather fronts caused by colliding air masses.
- Explain the symbols that are used on a surface weather analysis.
- List different ways that engineers are involved in storm prediction, analysis and protection.
Educational Standards
Each TeachEngineering lesson or activity is correlated to one or more K-12 science,
technology, engineering or math (STEM) educational standards.
All 100,000+ K-12 STEM standards covered in TeachEngineering are collected, maintained and packaged by the Achievement Standards Network (ASN),
a project of D2L (www.achievementstandards.org).
In the ASN, standards are hierarchically structured: first by source; e.g., by state; within source by type; e.g., science or mathematics;
within type by subtype, then by grade, etc.
Each TeachEngineering lesson or activity is correlated to one or more K-12 science, technology, engineering or math (STEM) educational standards.
All 100,000+ K-12 STEM standards covered in TeachEngineering are collected, maintained and packaged by the Achievement Standards Network (ASN), a project of D2L (www.achievementstandards.org).
In the ASN, standards are hierarchically structured: first by source; e.g., by state; within source by type; e.g., science or mathematics; within type by subtype, then by grade, etc.
NGSS: Next Generation Science Standards - Science
| NGSS Performance Expectation | ||
|---|---|---|
|
MS-ESS2-5. Collect data to provide evidence for how the motions and complex interactions of air masses results in changes in weather conditions. (Grades 6 - 8) Do you agree with this alignment? |
||
| Click to view other curriculum aligned to this Performance Expectation | ||
| This lesson focuses on the following Three Dimensional Learning aspects of NGSS: | ||
| Science & Engineering Practices | Disciplinary Core Ideas | Crosscutting Concepts |
| Collect data to produce data to serve as the basis for evidence to answer scientific questions or test design solutions under a range of conditions. Alignment agreement: | The complex patterns of the changes and the movement of water in the atmosphere, determined by winds, landforms, and ocean temperatures and currents, are major determinants of local weather patterns. Alignment agreement: Because these patterns are so complex, weather can only be predicted probabilistically.Alignment agreement: | Cause and effect relationships may be used to predict phenomena in natural or designed systems. Alignment agreement: |
International Technology and Engineering Educators Association - Technology
-
Explain how knowledge gained from other content areas affects the development of technological products and systems.
(Grades
6 -
8)
More Details
Do you agree with this alignment?
-
Develop innovative products and systems that solve problems and extend capabilities based on individual or collective needs and wants.
(Grades
6 -
8)
More Details
Do you agree with this alignment?
State Standards
Colorado - Science
-
Differentiate between basic and severe weather conditions, and develop an appropriate action plan for personal safety and the safety of others
(Grade
8)
More Details
Do you agree with this alignment?
-
Use models to develop and communicate a weather prediction
(Grade
8)
More Details
Do you agree with this alignment?
Pre-Req Knowledge
Students should have a basic knowledge of air pressure and air masses, both of which are covered in lesson 2, Air Under Pressure.
Introduction/Motivation
Have you ever watched a weather forecast on the television and seen a map of your area with thick red and blue lines that the meteorologist points to when predicting the upcoming weather? These maps are actually a type of surface weather analysis that shows us many different parts of weather over a particular area at a specific time, based on the information collected from ground-based weather stations. These maps combine the information of air pressure, temperature and humidity to determine where and how weather systems are moving.
Pressure differences in our atmosphere's air masses cause them to constantly shift and change, along with our weather. With all these air masses moving around in our atmosphere, they are sure to collide with each other...and they do! Even though they bump into each other, these air masses rarely mix because of their different densities. Instead, storms and other severe weather phenomena form along the boundaries of the air masses. This area is called a weather front. Four possible types of weather fronts are: 1) warm fronts, 2) cold fronts, 3) occluded fronts and 4) stationary fronts. How do you know which kind of front will form? Well, that all depends on the properties of the air masses that are colliding.
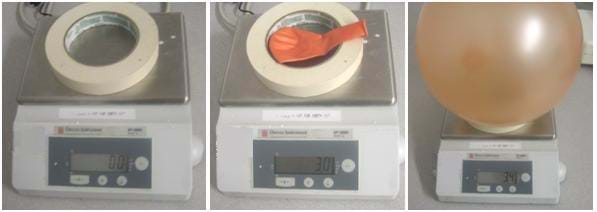
Demonstration: To really understand air mass, we must understand that air has mass. We can use a balloon and a scale to demonstrate this concept. (To begin, zero the scale, then record the mass of the empty balloon. Next, blow up and tie the balloon that was weighed, and place the inflated balloon back on the scale. Record the new mass. Use a roll of tape to keep the balloon from rolling off the scale. Make sure that the scale is zeroed with the roll of tape on the scale as shown in Figure 2). The scale should be able to measure to a tenth of a gram for it to detect the mass of the air in the balloon.)

A warm front is the leading edge of a mass of moving warm air. Warm fronts usually move slowly and are often marked by rain and cloudy skies. Cold fronts form when quickly moving cold air masses collide with more slowly moving warm air masses. Because cold air is denser, it sinks beneath warm air. And since cold fronts move quickly, they are also associated with quickly-changing weather conditions, which may include thunderstorms. Cold fronts are usually associated with lower air pressure. Next, an occluded front occurs when a cold air front takes over a warm air front. This can be like an air mass sandwich, in which the warm air mass becomes stuck between two cold air masses. The denser cold air masses lodge themselves around the warm air mass, pushing the warm air mass farther away from the Earth's surface. The cold air masses are then left to mix near the ground, cooling the temperatures we experience. Usually these fronts are associated with a drying of the air. Lastly, a stationary front refers to the meeting of two air masses that do not overtake each other. With this front, a cold air mass and a warm air mass may be next to each other, but they move along at the same pace, leading to extended rain, snow, fog or clouds at the boundary.

Weather fronts are displayed on the surface weather analysis by thick lines — blue lines for cold fronts, red lines for warm fronts, purple lines for occluded fronts, and combined red/blue lines for stationary fronts. Areas of high pressure are indicated on the surface weather analysis with a letter H, and low pressure with a letter L. All of these symbols on the map help us understand how the weather is moving in a region.
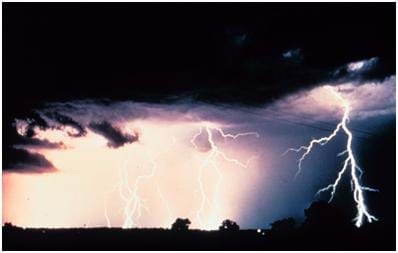
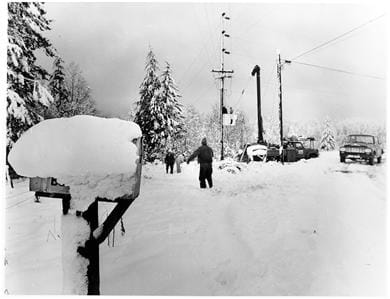
Storms are associated with the different weather fronts and can include strong winds, thunder and lightning, and precipitation. Sometimes the strong winds move dust and snow through the air masses. Engineers design storm detection systems, such as weather radar and lightning strike indicators, to provide early storm warnings to keep people safe. They also develop warning systems to alert people to coming severe storms. Following the lesson, conduct the associated activity Weather Alert where students can act as engineers in designing their own model lightning detection system. By developing technology that allows people to predict storms and launch warning systems, engineers help in the effort to save lives from destructive storms. Engineers also help our communities design systems to manage all the extra rainwater and runoff from a storm.
Lesson Background and Concepts for Teachers
Severe Weather
Thunderstorms usually occur during the spring and/or summer, when the air is warm and unstable, rising to "float" above colder air. Five steps precede the occurrence of a thunderstorm. The process begins when warm, wet air rises from the ground. Once the air rises high enough, it begins to cool and form clouds, which continue to rise. Once the clouds rise about 40,000 feet, depending on the temperature, large heavy water droplets or huge frozen ice crystals begin to form. These particles then fall back through the clouds, creating powerful downdrafts. On Earth, we would likely experience such a storm as heavy rain, thunder and lightning. A single bolt of lightning can carry about 30 million volts — enough electrical energy to power all of New York.

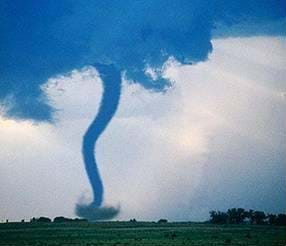
Tornadoes form when the warm, wet updrafts of a thunderstorm come close to a strong, central downdraft. If the wind hitting the top of the storm cloud is blowing in a different direction from the wind below it, the storm system starts to rotate. As the warm and cold air currents interact, the storm begins to rotate faster and faster, accelerating winds to blow as fast as 300 miles per hour. The funnel of a tornado can be as small as 50 feet or as big as one mile wide, allowing tornadoes to damage areas up to 100 miles long. Most tornadoes exist for fewer than 15 minutes.
Hurricanes are huge storms that form over very warm, tropical waters when unstable air has a unique mix of both high and low pressures. A hurricane is essentially a cluster of several thunderstorms that have formed together. The storm is classified as a hurricane if the storm winds are detected to be 74 miles per hour or higher. Hurricanes can last from several hours to several weeks.
Associated Activities
- Weather Alert - Students design a simple model lightning detection system and analyze its effectiveness as a storm-warning system.
Lesson Closure
Today we discussed weather fronts and storms. Who can name the four possible types of weather fronts? (Answer: warm fronts, cold fronts, occluded fronts and stationary fronts.) The type of front depends on the properties of the air masses that are colliding.
We can see where weather fronts are located if we look at the weather forecast in the newspaper, on the television, or on the internet. Engineers help us predict weather fronts by designing weather stations that accumulate data for air pressure, temperature, humidity and air movement. These measurements are combined and commonly displayed on surface weather analysis maps. What color lines are used on maps to indicate the types of weather fronts? (Answer: blue lines for cold fronts, red lines for warm fronts, purple lines for occluded fronts, and combined red/blue lines for stationary fronts.) And what symbols indicate high and low pressure areas? (Answer: Aeas of high pressure are indicated on surface weather analysis with a letter H, and low pressure with a letter L.) All of these symbols help us describe and understand how the weather is moving.
By understanding how storms move around our area, we can better predict the nature, timing and magnitude of storms when they are in the early stages of development. This knowledge allows us to prepare for storms and, therefore, minimize any possible destruction or impact they may have on our daily lives. Engineers also help to develop instruments that measure different weather conditions before and during storms. So, engineers work to keep communities safe and by helping predict the timing and magnitude of storms.
Vocabulary/Definitions
hurricane: A tropical storm with winds of 74 miles per hour or higher.
storm: A violent disturbance in the atmosphere.
thunderstorm: A disturbance that occurs when the air is warm and unstable, floating above colder air.
tornado: A spinning, funnel shaped-cloud that hits the Earth's surface, usually causing destruction.
weather front: The area where air masses meet and do not mix.
Assessment
Pre-Lesson Assessment
Brainstorming: As a class, have students engage in open discussion. Remind them that in brainstorming, no idea or suggestion is "silly." All ideas should be respectfully heard. Take an uncritical position, encourage wild ideas and discourage criticism of ideas. Have students raise their hands to respond. Write their ideas on the board. Ask the students:
- What do you think causes storms? (Listen to students' ideas about rainstorms, snow, hail, sleet, hurricanes, tornadoes, etc.)
Ask students to create a list of storms they have experienced. What were those storms like? How do you think they formed?
Post-Introduction Assessment
Discussion Question: Ask the students and discuss as a class:
- What are different ways that engineers are involved in storm prediction, analysis and protection?
Concept Reflections/Journal Writing: Have students reflect on the nature of interesting or severe storms they have experienced. Now that they have learned about the basics of weather formation, what do they think might have led up to the storm they experienced? Can they think of ways that engineers helped keep them safe during the storms?
Lesson Summary Assessment
Weather Map: Bring in an example of a weather map from an local newspaper. Have students discuss the symbols they see on the map. Can they locate the weather fronts or the high and low pressure areas? Are other symbols used t`o represent rain, sun or snow? Can they use the map to predict future weather? How do engineers help us develop the weather map that they are looking at?
Lesson Extension Activities
The ground-based weather stations that provide us with our information are designed by engineers. These weather stations help us take measurements of all the different components of weather systems and then combine those measurements for an accurate display of the total weather. Have students locate the weather stations around their area that provide them with the local weather forecast.
Have students research a historically significant and severe storm from your area or another part of the world. How did the storm form? What kind of impact did it have on peoples' lives? Were warning systems available to provide information about the storm in advance? Ideas include legendary blizzards, tornadoes, hurricanes, etc.
Subscribe
Get the inside scoop on all things Teach Engineering such as new site features, curriculum updates, video releases, and more by signing up for our newsletter!More Curriculum Like This

Students are introduced to air masses, with an emphasis on the differences between and characteristics of high- versus low-pressure air systems. Students explore actual data by comparing maps of high- and low-pressure air masses to radar data showing where weather is occurring

Students are introduced to natural disasters and learn the difference between natural hazards and natural disasters.

Students discuss the characteristics of storms, including the relationship of weather fronts and storms. Using everyday materials, they develop models of basic lightning detection systems (similar to a Benjamin Franklin design) and analyze their models to determine their effectiveness as community s...

Students learn what causes hurricanes and what engineers do to help protect people from destruction caused by hurricane winds and rain.
References
Short, Nicholas, M., Sr. "Precipitation, Storms and Other Weather Phenomena; Climate." The Water Planet – Meteorological, Oceanographic and Hydrologic Applications of Remote Sensing. Last updated November 1, 2010. The Remote Sensing Tutorial, Goddard Space Flight Center, NASA. Accessed December 19, 2010. (excellent resource) http://www.fas.org/irp/imint/docs/rst/Sect14/Sect14_1d.html
US Dept of Commerce, National Oceanic and Atmospheric Administration, National Weather Service, Western Region Headquarters, November 11, 2007, accessed November 26, 2007. http://www.wrh.noaa.gov/images/pqr/snow.gif
Wilson, Jim. National Aeronautics and Space Administration, Images, November 26, 2007, accessed November 26, 2007. http://www.nasa.gov/images/content/105020main_thunderstorm_night_lg.jpg
Copyright
© 2007 by Regents of the University of Colorado.Contributors
Marissa Forbes; Glen Sirakavit; Malinda Schaefer Zarske; Janet YowellSupporting Program
Integrated Teaching and Learning Program, College of Engineering, University of Colorado BoulderAcknowledgements
The contents of this digital library curriculum were developed under a grant from the Fund for the Improvement of Postsecondary Education (FIPSE), U.S. Department of Education and National Science Foundation GK-12 grant no. 0338326. However, these contents do not necessarily represent the policies of the Department of Education or National Science Foundation, and you should not assume endorsement by the federal government.
Last modified: July 1, 2019


User Comments & Tips