
Quick Look
Grade Level: 9 (9-10)
Time Required: 45 minutes
Expendable Cost/Group: US $0.00 Activity requires the use of (non-expendable) computers with Internet access, one per student or team.
Group Size: 1
Activity Dependency:
Subject Areas: Biology, Life Science, Problem Solving, Science and Technology
Quick Look

- Grade Level:
- 9 (9 – 10)
- Time Required:
- 45 minutes
- Group Size:
- 1
- Subject Areas:
-
Biology Life Science Problem Solving Science and Technology
Summary
Using a website simulation tool, students build on their understanding of random processes on networks to interact with the graph of a social network of individuals and simulate the spread of a disease. They decide certain variables which impact the spread of the disease with the goal to "curb the epidemic." Since the results are random, they run multiple simulations and compute the average number of infected individuals before analyzing the results and assessing the effectiveness of their vaccination strategies. This engineering curriculum meets Next Generation Science Standards (NGSS).
Engineering Connection
Simulations of real systems are used throughout science and engineering to test hypotheses, understand the nature of particular problems, and generate effective solutions. For example, biomolecular engineers use computers to extensively simulate complex reaction networks in order to form and test hypotheses about how interactions of certain molecules (such as proteins) in our cells lead to disease (such as cancer). Public health professionals also use computer simulations to provide solutions to the challenge of distributing the smallest possible number of vaccines in order to minimize the number of people falling ill to infectious diseases. For example, when the flu arrives in a highly populated area, distributing a limited number of vaccines in an appropriate manner is key to minimizing distribution costs and alleviating potential vaccine shortages.
Learning Objectives
After this activity, students should be able to:
-
Use a website simulation to simulate the spread of a disease on a social network of interacting individuals.
- Determine a vaccination strategy that minimizes the number of people infected by the disease.
- Compute an appropriate quantity for evaluating the effectiveness of a vaccination strategy.
Educational Standards
Each Teach Engineering lesson or activity is correlated to one or more K-12 science,
technology, engineering or math (STEM) educational standards.
All 100,000+ K-12 STEM standards covered in Teach Engineering are collected, maintained and packaged by the Achievement Standards Network (ASN),
a project of D2L (www.achievementstandards.org).
In the ASN, standards are hierarchically structured: first by source; e.g., by state; within source by type; e.g., science or mathematics;
within type by subtype, then by grade, etc.
Each Teach Engineering lesson or activity is correlated to one or more K-12 science, technology, engineering or math (STEM) educational standards.
All 100,000+ K-12 STEM standards covered in Teach Engineering are collected, maintained and packaged by the Achievement Standards Network (ASN), a project of D2L (www.achievementstandards.org).
In the ASN, standards are hierarchically structured: first by source; e.g., by state; within source by type; e.g., science or mathematics; within type by subtype, then by grade, etc.
NGSS: Next Generation Science Standards - Science
-
When investigating or describing a system, the boundaries and initial conditions of the system need to be defined and their inputs and outputs analyzed and described using models.
(Grades 9 - 12)
More Details
Do you agree with this alignment?
-
Models (e.g., physical, mathematical, computer models) can be used to simulate systems and interactions—including energy, matter, and information flows—within and between systems at different scales.
(Grades 9 - 12)
More Details
Do you agree with this alignment?
-
Analyze data using computational models in order to make valid and reliable scientific claims.
(Grades 9 - 12)
More Details
Do you agree with this alignment?
-
Use a model to predict the relationships between systems or between components of a system.
(Grades 9 - 12)
More Details
Do you agree with this alignment?
-
Create a computational model or simulation of a phenomenon, designed device, process, or system.
(Grades 9 - 12)
More Details
Do you agree with this alignment?
Common Core State Standards - Math
-
Summarize, represent, and interpret data on a single count or measurement variable
(Grades
9 -
12)
More Details
Do you agree with this alignment?
-
Make inferences and justify conclusions from sample surveys, experiments, and observational studies
(Grades
9 -
12)
More Details
Do you agree with this alignment?
International Technology and Engineering Educators Association - Technology
-
Analyze the stability of a technological system and how it is influenced by all the components in the system, especially those in the feedback loop.
(Grades
9 -
12)
More Details
Do you agree with this alignment?
State Standards
Florida - Math
-
Use data from a sample survey to estimate a population mean or proportion; develop a margin of error through the use of simulation models for random sampling.
(Grades
9 -
12)
More Details
Do you agree with this alignment?
Florida - Science
-
Explain how scientific knowledge and reasoning provide an empirically-based perspective to inform society's decision making.
(Grades
9 -
12)
More Details
Do you agree with this alignment?
National Council of Teachers of Mathematics - Math
-
use representations to model and interpret physical, social, and mathematical phenomena
(Grades
Pre-K -
12)
More Details
Do you agree with this alignment?
Materials List
Each student needs:
- computer with internet access
- Curb the Epidemic Worksheet
- pen or pencil
- (optional) calculator
Worksheets and Attachments
Visit [www.teachengineering.org/activities/view/jhu_cnetworks_lesson02_activity1] to print or download.Introduction/Motivation
(Begin by asking students a few questions about modeling complex networks for infection control and the SIR model, as described in the Assessment section.)
Public policy makers must often make difficult choices when deciding how to use limited resources. Often, no single "obvious" choice exists, and decisions are usually guided by computer simulations.
Today, you will be presented with a social network of individuals and asked to choose certain variables such as amount of people vaccinated and population density. Then, you will test your choices by running simulations and analyzing the results.
Procedure
Background
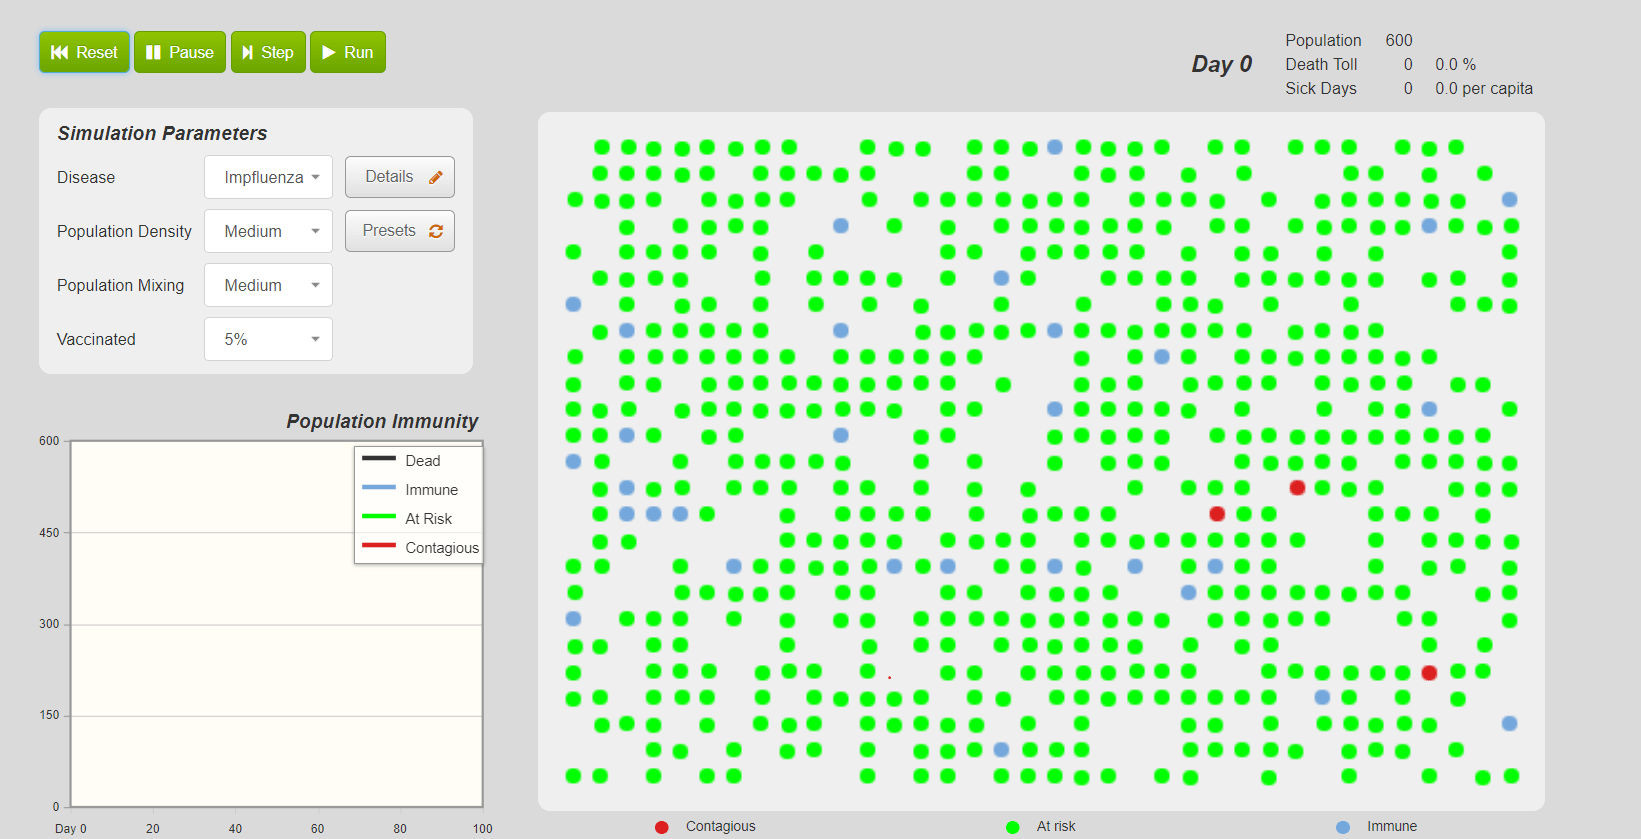
In this activity, students simulate how the flu spreads on a social network. To do this, they use the freely accessible interactive application, Interactive Labs: Disease Lab, available at this Annenberg Learner website: https://www.learner.org/series/the-habitable-planet-a-systems-approach-to-environmental-science/disease-lab/.
A few pointers:
- The interactive simulation of a graph represents a social network (nodes) who interact with each other in a manner determined by their orientation and location on the plot diagram.
- The node color represents the state of that node with respect to infection: at risk individuals are green nodes, contagious individuals are red and immune individuals are blue.
- The user defined number of infected individuals start off as infectious (red); all other nodes start off as at risk (green).
- Users simulate a single time step by pressing the "Take Timestep" button, which enables visualization of how a disease spreads over a social network. In each time step, infection spreads with probability 0.5, and infected individuals recover with probability 0.25.
- The disease is eradicated when no nodes are red (that is, contagious), meaning no one can become infected anymore.
- Push the reset button to clear the simulation.
Refer to the associated Processes on Complex Networks lesson for background information on random processes on networks and the SIR (susceptible, infectious, resistant) model.
Before the Activity
- Make copies of the Curb the Epidemic Worksheet.
- Set up enough computers with internet access, either one student per machine, or small groups of students per machine.
With the Students
- Have students each sit at a computer (or divide the class into small groups, each at a computer).
- Hand out the worksheet.
- Direct students to open up the Interactive Labs: Disease Lab simulation website at https://www.learner.org/series/the-habitable-planet-a-systems-approach-to-environmental-science/disease-lab/.
- Introduce the activity challenge to students: This website simulation tool enables you to interact with the graph of a social network and simulate the spread of a disease. Your challenge: Minimize the number of people who get infected with the flu by examining the social network and mindfully choosing input variables such as percent vaccinated, population density and population mixing. After you have run multiple simulations, you'll analyze the results and assess the effectiveness of your vaccination strategies.
- Familiarize students with how the interactive simulation works. Point out the simulation's main features and variables. Give them a minute to play with it and reset by pushing the reset button.
- Before students start the simulations, pose the following problem to the class: When running a simulation, you need to keep track of the number of infected individuals (red nodes) at each time step in order to record the total number of infected individuals at the end of each simulation. This can be tedious and prone to errors. Does anyone see a quick calculation that can be performed at the end of each simulation to find the total number of individuals infected during the simulation? (Answer: At the end of each simulation only at risk individuals (green nodes) and immune individuals (blue nodes) will remain. You know that some individuals are immune due to vaccination (based on input variables), while the rest are contagious because they were infected at some point during the simulation. Therefore, you can simply count the number of immune individuals (all green nodes) at the end of a simulation and subtract from the total population to obtain the total number of individuals infected during the simulation.
- Direct students to run their simulations, using the worksheet to record data and answer questions. Each student should use his/her same input choices to run 10 separate simulations, starting from the beginning until the disease is completely eradicated. After each simulation, record in the worksheet table how many nodes became infected during the course of that simulation (that is, once the flu virus runs its course).
- After all students have completed the simulations, ask them to compute the average number of nodes infected in their simulations and record this number on the worksheet.
- As a class, call on the three students with the lowest averages to explain why they chose the input values that they did. For extra credit (or as time permits), have students investigate which vaccination choices are the least effective. Students may enjoy attempting to maximize the size of the epidemic.
- Have students turn in their worksheets for grading.
- Conclude by leading a class discussion to compare results and conclusions.
Vocabulary/Definitions
contagious: A student capable of spreading a disease.
immune: A student who is resistant to future infections of the same disease.
probability: A number (between 0 and 1) that tells us how probable the occurrence of an event is, with 0 meaning that the event cannot happen and 1 meaning that the event always happens.
process: A variable that changes with time.
random process : A variable that changes with time, but cannot be completely predicted.
simulation: A calculation of a process using computers.
SIR model: A mathematical model of disease spreading over social networks.
susceptible: A student capable of becoming infected by a disease (at risk).
Assessment
Pre-Activity Assessment
Opening Questions: Before starting the activity, ask students a few questions to review what they learned in the Processes on Complex Networks lesson.
- What do the terms susceptible, infected, and immune mean when we are talking about modeling an epidemic?
- What is the SIR model of disease spreading and what is it used for?
- How does the SIR model relate to graphs and complex networks?
- What does it mean to simulate the SIR model?
- What is the purpose of vaccination and how can it be incorporated into the SIR model?
Activity-Embedded Assessment
Focus: Monitor the students and observe their level of engagement in the simulation activity.
Post-Activity Assessment
Worksheet: As students run their simulations, have them complete the Curb the Epidemic Worksheet to record their data and answer questions, including an extra credit run. Review their answers to gauge their mastery of the subject matter.
Analytical Discussion: Ask students to share the strategies they used to best meet the challenge (the fewest infected nodes in order to minimize the epidemic). As time permits, have them re-run the activity, making improvements to their approach using successful strategies learned from other students and the class discussion, or applying the lessons learned to the extra credit challenge to maximize the epidemic.
Additional Multimedia Support
This activity uses the freely accessible interactive application, Interactive Labs: Disease Lab, available at this Annenberg Learner website: https://www.learner.org/series/the-habitable-planet-a-systems-approach-to-environmental-science/disease-lab/.
Related to the topic, show students a four-minute video by Penn State University researchers called Science Cast: How Easily Do Diseases Spread through a Closed Group of People? on YouTube: https://www.youtube.com/watch?v=5rWKlN_nz5Y
Subscribe
Get the inside scoop on all things Teach Engineering such as new site features, curriculum updates, video releases, and more by signing up for our newsletter!More Curriculum Like This

Building on their understanding of graphs, students are introduced to random processes on networks. They walk through an illustrative example to see how a random process can be used to represent the spread of an infectious disease, such as the flu, on a social network of students.

Students learn about complex networks and how to use graphs to represent them. An illustrative example shows how a random process can be used to represent the spread of an infectious disease, such as the flu, on a social network of students, and demonstrates how scientists and engineers use mathemat...

Students learn and apply concepts and methods of graph theory to analyze data for different relationships such as friendships and physical proximity. They are asked about relationships between people and how those relationships can be illustrated.

Students apply concepts of disease transmission to analyze infection data, either provided or created using Bluetooth-enabled Android devices.

Copyright
© 2013 by Regents of the University of Colorado; original © 2012 The Johns Hopkins UniversityContributors
Garrett Jenkinson and John Goutsias, The Johns Hopkins University, Baltimore, MD; Debbie Jenkinson and Susan Frennesson, The Pine School, Stuart, FLSupporting Program
Complex Systems Science Laboratory, Whitaker Biomedical Engineering Institute, The Johns Hopkins UniversityAcknowledgements
The generous support of the National Science Foundation, Directorate for Computer and Information Science and Engineering (CISE), Division of Computing and Communication Foundations (CCF), is gratefully acknowledged.
Last modified: September 10, 2021
User Comments & Tips