Quick Look
Grade Level: 6 (5-7)
Time Required: 45 minutes
Expendable Cost/Group: US $0.00 This activity requires use of non-expendable (re-usable) LEGO MINDSTORMS® robot kit, touch sensors and software; see the Materials List for details.
Group Size: 3
Activity Dependency: None
Subject Areas: Measurement
Summary
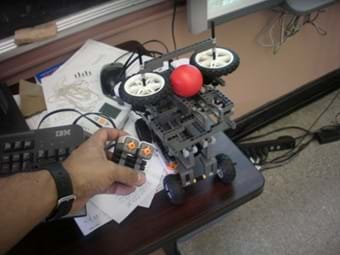
Students use a LEGO® ball shooter to demonstrate and analyze the motion of a projectile through use of a line graph. This activity involves using a method of data organization and trend observation with respect to dynamic experimentation with a complex machine. Also, the topic of line data graphing is covered. The main objective is to introduce students graphs in terms of observing and demonstrating their usefulness in scientific and engineering inquiries. During the activity, students point out trends in the data and the overall relationship that can be deduced from plotting data derived from test trials with the ball shooter.Engineering Connection
Engineers look at the "big picture" when considering changes to machines, structures and processes. When it comes to complex machines, engineers examine time looking at every part to get an idea of how changes in power affect the speed at which a machine launches projectiles. However, it is possible to see how machines "behave" simply by graphing the speed "output" of the machine vs. its power "input" in order to get a good idea of how speed changes with power. In this way, engineers can get a better idea of how the machine works in the real world instead of relying solely on theoretical calculations, and without having to spend too much time looking at every machine part. Graphing is important for engineers to understand so that they can determine the relationship between two measured quantities—the "big picture." Graphing has been used for thousands of years, in a variety of forms; today, graphing remains beneficial to engineers in solving many day-to-day challenges that arise.
Learning Objectives
After this activity, students should be able to:
- Organize and plot data on 2-D Cartesian coordinate grids.
- Make inferences about the relationship between the collected data parameters with respect to the plotted data.
Educational Standards
Each TeachEngineering lesson or activity is correlated to one or more K-12 science,
technology, engineering or math (STEM) educational standards.
All 100,000+ K-12 STEM standards covered in TeachEngineering are collected, maintained and packaged by the Achievement Standards Network (ASN),
a project of D2L (www.achievementstandards.org).
In the ASN, standards are hierarchically structured: first by source; e.g., by state; within source by type; e.g., science or mathematics;
within type by subtype, then by grade, etc.
Each TeachEngineering lesson or activity is correlated to one or more K-12 science, technology, engineering or math (STEM) educational standards.
All 100,000+ K-12 STEM standards covered in TeachEngineering are collected, maintained and packaged by the Achievement Standards Network (ASN), a project of D2L (www.achievementstandards.org).
In the ASN, standards are hierarchically structured: first by source; e.g., by state; within source by type; e.g., science or mathematics; within type by subtype, then by grade, etc.
Common Core State Standards - Math
-
Represent real world and mathematical problems by graphing points in the first quadrant of the coordinate plane, and interpret coordinate values of points in the context of the situation.
(Grade
5)
More Details
Do you agree with this alignment?
-
Construct and interpret scatter plots for bivariate measurement data to investigate patterns of association between two quantities. Describe patterns such as clustering, outliers, positive or negative association, linear association, and nonlinear association.
(Grade
8)
More Details
Do you agree with this alignment?
International Technology and Engineering Educators Association - Technology
-
Use instruments to gather data on the performance of everyday products.
(Grades
6 -
8)
More Details
Do you agree with this alignment?
State Standards
New York - Math
-
Use physical objects, drawings, charts, tables, graphs, symbols, equations, or objects created using technology as representations
(Grade
6)
More Details
Do you agree with this alignment?
-
Recognize and provide examples of the presence of mathematics in their daily lives
(Grade
6)
More Details
Do you agree with this alignment?
-
Investigate the presence of mathematics in careers and areas of interest
(Grade
6)
More Details
Do you agree with this alignment?
Materials List
Each group needs:
- colored pencil(s)
- Ball Shooter Graphing Worksheet, one per student
- (optional) graph paper (the worksheet includes a grid)
For the class to share:
- LEGO MINDSTORMS EV3 robot, such as EV3 Core Set (5003400) at https://education.lego.com/en-us/products/lego-mindstorms-education-ev3-core-set/5003400#lego-mindstorms-education-ev3 (includes programmable EV3intelligent brick; 3 2 interactive servo motors; sound, color, ultrasonic and 2 touch sensors; and many other components and instructions)
- LEGO MINDSTORMS Education EV3 Software 1.2.1, free online, you have to register a LEGO account first; at https://www.lego.com/en-us/mindstorms/downloads/download-software
- 2 LEGO MINDSTORMS touch sensors (two sensors are included in the base kit; a total of four are needed for the activity),
- 1 or more classroom computers/laptops loaded with LEGO Digital Designer software (download from https://www.lego.com/en-us/ldd#full-section-2)
Note: This activity can also be conducted with the older (and no longer sold) LEGO MINDSTORMS NXT set instead of EV3; see below for those supplies:
- LEGO MINDSTORMS NXT robot, such as the NXT Base Set
- computer loaded with the NXT 2.1 software
Worksheets and Attachments
Visit [www.teachengineering.org/activities/view/nyu_graphing_activity1] to print or download.Pre-Req Knowledge
Basic understanding of number data organization and units of measurement.
Introduction/Motivation
Let's start with an example to introduce you to the usefulness of graphing. Imagine that you and your friends want to quickly walk to your house after school. Each of you walks along the same route from the school to your home. As you move forward, you notice that one of your friends is moving faster, another is moving slower, and the third is moving at the same pace as you. It is interesting, you notice, that each of you traveled the same distance along the same route, yet realistically may get to your house at different times. As you think about it, you realize that it is difficult to keep track of who is arriving when, and how long it took each to arrive. Instead of just "thinking" about this information, it would be much better (and easier) if that information was organized into a manner that allows you to "see" all of the data at once. This is where graphing comes in handy.
Graphing allows us to visually see and interpret what is going on with one quantity as another measured quantity changes. For example, if you recorded your distance during the walk from the start point at every minute, the data you collect could be organized similar to this (draw Figure 1 on the classroom board). 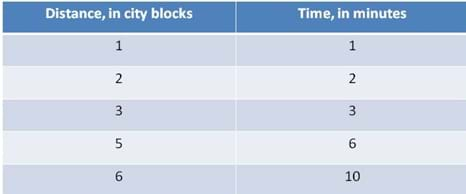
Each quantity has its own column (that is, in this case, distance and time). Each measurement of distance has a corresponding measurement of time. Once the data is organized, we can plot it to make a graph.
To graph data, it is easiest to use pre-printed graph paper. What if you have no graph paper to use? Well, you can just draw evenly-spaced lines running vertically and horizontally along a blank sheet of paper. These lines make up what is called a grid. The grid is what you use to plot your data. Before you plot though, you must first name the top and bottom borders of your grid, which identify the type of data you are displaying. To do this, draw a line along the left edge of the grid, as well as along the bottom edge of the grid. The lines are perpendicular to one another, touching at far left/bottom-most corner of the grid. Typically, the free end (the end not at the intersection of the two lines) has an arrow (see Figure 2). These border lines are called coordinate axes or x,y axes. The y-axis is the vertical axis on the left of the grid, while the x-axis is below the grid, a horizontal line. (Tip: To remember which is x and which is y, think "Y to the sky; X to the side!")
To use the grid, write numbers along the coordinate axes to label values of quantities that are measured or recorded. We denote measurements by drawing dots on the grid. We call these dots coordinate points, since we mark them using coordinate axes as reference. Each data point is described in (x,y) format, where the first number denotes the value according to the x-axis, and the second value denotes the value according to the y-axis.
As an example, let's graph the data in Figure 1, where each row the table is used as coordinate points. The values for distance traveled in city blocks are displayed on the y-axis, while the time in minutes is shown on the x-axis. 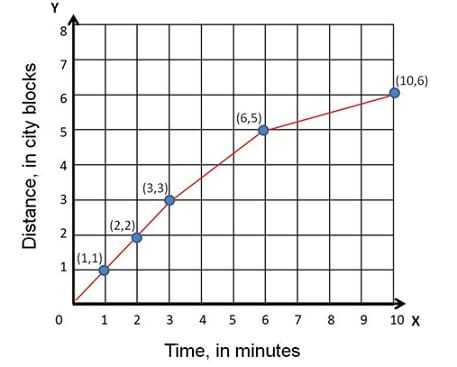
In looking at the graph and the line running through all the points, we can see how far you went for each minute you walked to your house. During the first three minutes, we can see that you kept a steady pace, but then you slowed down a bit during the next three minutes. We can determine this because the distance travelled did not increase as much in the same span of time as the previous three minutes. By looking at the graph, we can make the assumption that you must have become tired because in the last four minutes of your walk, you only traveled one city block. We can learn all this by simply organizing data and plotting a few points.
For this graphing example, we do not have to restrict ourselves to time and distance; many different quantities can be plotted with each other. Machines and structures that engineers and scientists use are studied and tested using this kind of data collection and organization. The important thing is to observe changes (if any) on one quantity as the other changes, so that you can better understand a relationship between the two measured quantities. It's all about looking at the "big picture."
In this activity, you will act as you are engineers as we test a pre-made LEGO ball shooter, which is a machine that is similar to a pitching machine used to launch balls in tennis courts and batting cages. We collect and plot data on two quantities: power level of the ball shooter's motors and the distance that the ball is launched. For each group, we run five trials, where the ball shooter is set to five different power levels. Then we measure how far a plastic ball is shot out of the shooter after each trial. Once the data is collected, it is organized in table form, and plotted using coordinate axes. In this way, we can see what happens to the ball's distance as the power changes, and then identify the relationship between the two quantities. In this way, we get a better idea of how the LEGO ball shooter works when shooting projectiles at different power levels.
Procedure
Background
To ensure consistency of engineered designs during service use, a design must be tested repeatedly in order to ensure consistent use, especially when the design involves the use of dynamic parts and projectiles such as cannons, missiles, guns, liquid jet streams and even the human arm. Of course, in the case of many engineered systems that shoot projectiles, you would need to change the distance that the projectile needs to travel through changes in the power used in the system, since the target you aim for may be located at different distances. For example, inside of a batting cage, a pitching machine is powered to shoot baseballs over home plate. The speed at which the baseballs are "pitched" to the batter may be controlled by adjusting the power of the motor that runs the machine. The more power given, the faster the machine moves, and thus the ball travels faster. However, when it comes to such machines, it is unsure if increasing the power a small amount will increase the speed of the ball by a small amount or by a large amount. It generally depends on the machine and how it is being used. When it comes to complex machines, engineers may spend a lot of time looking at each and every part to get an idea of how the changes in power given to the machine affects the speed at which it launches projectiles. However, it is still possible to see how machines "behave" simply by graphing the speed "output" of the machine vs. its power "input" in order to get a good idea of how speed changes with power. In this way, engineers can get a better idea of how the machine works in the real world instead of relying on calculations done "on paper" without having to spend too much time looking at every machine part.
Before the Activity
- On one or more classroom computers/laptops, download the LEGO Digital Designer software from http://ldd.lego.com.
- Create one (or two if you have the materials) LEGO ball shooter, following the instructions in the Ball Shooter CAD.lxf file. Open the lxf file using LEGO Digital Designer software.
- Attach four touch sensors to ports 1-4, and the motors to ports A-C of the LEGO EV3 as per the LEGO Digital Designer instructions. The pushbuttons connected to ports 1 and 4 (in accordance with the program) change the power level, effectively changing the speed of the rotating wheels. Pushbuttons 2 and 3 cause the ball shooter to rotate. However, for this activity, the power level is the varying quantity.
- Install LEGO MINDSTORMS EV3 1.2.1 software.
- Download a power control program onto the EV3 brick using the MINDSTORMS EV3 software. Figure 3 denotes the general structure of the program. The program is already provided so that you do not need to construct your own.
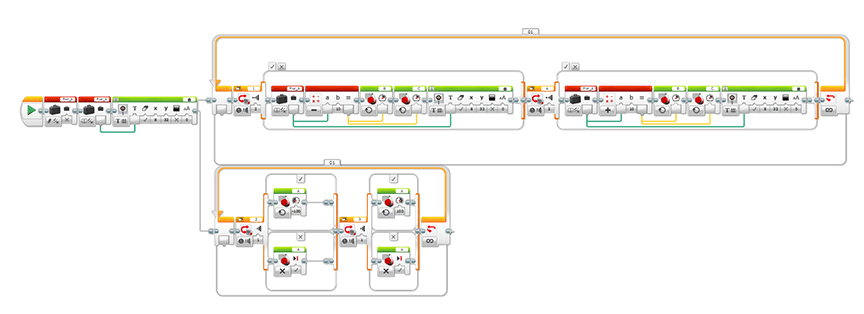
Figure 3. The EV3-G code for LEGO ball-shooter system (the power control program). - Attach a USB cable from the LEGO EV3 brick to the computer that is running the MINDSTORMS EV3 software and turn on the EV3 brick.
- Once the pre-made power control program is opened in the EV3 software, download the program onto the EV3 brick by clicking on the Download button, as shown in Figure 4.
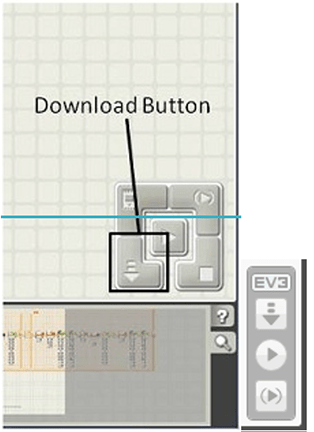
Figure 4. The Download button downloads the pre-made program onto the EV3 brick. - Once the program is downloaded onto the EV3, ensure that the EV3 brick is on and scroll through the menus using the select and scroll buttons, as shown in Figure 5. Go to My Files > Software files > (name of downloaded program). The program is named Ball Shooter by default, but it can be changed by the user. Select the program to run.
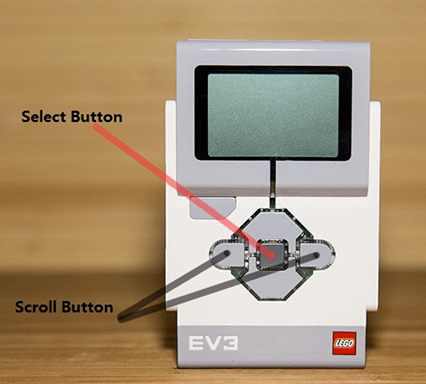
Figure 5. The select and scroll buttons are needed to scroll through the various menus in the EV3 brick. - Test the shooter at different power levels, which increases the speed of the turning wheels that launch the balls. (Note: Use the plastic balls that come with the LEGO MINDSTORMS EV3 kit #5003400 to launch through the set-up.)
With the Students
- Divide the class into groups of three students each. Have students work on the Ball Shooter Graphing Worksheets, working as a group if necessary.
- As students work to complete the worksheet, call one group at a time to work with each available set-up.
- Instruct students to turn on the ball shooter and set the power level up to/or above 50. Have one student push the LEGO plastic ball through the back of the ball shooter frame towards the spinning wheels. (Note: Both wheels on the ball shooter generally start moving at a power of 50 or above. Expect the balls to land at slightly greater distances as the power is incrementally increased.)
- A trial is complete when the ball is launched and lands on the floor. Instruct students to measure the distance from the point of launch to the point of impact on the floor (in inches or centimeters).
- Have students record the power level and the distance on their worksheets.
- Have students repeat steps 3 through 5, gradually increasing the higher power level with each trial by pressing the appropriate button on the power/angle control panel, shown in Figure 6.
- Instruct students to complete the graph on their worksheets. Suggest they use a different colored pencil to connect the points, so that the graph line stands out.
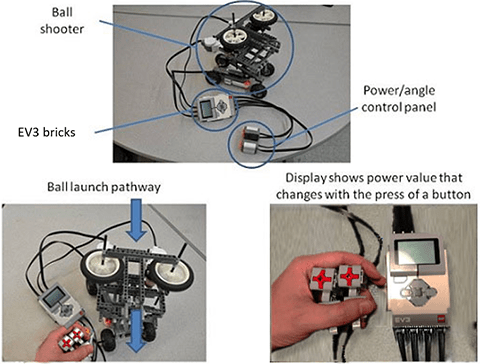
Figure 6. The ball shooter set-up allows you to view the power value as you increase or decrease the speed. - Using the data, have students draw their own line graphs on their worksheets. Have them draw their own distance (y-axis) vs. power level (x-axis) line graphs with at least 4-5 points, and have them connect the points. Once finished, compare results between teams.
Vocabulary/Definitions
coordinate (x,y) axes: Lines drawn on the sides of a graph to represent measured quantities.
coordinate point: Point drawn on a coordinate grid to denote a pair of values, each of a different quantity.
grid: A space with evenly-spaced horizontal and vertical lines for use in a line graph.
Assessment
Pre-Activity Embedded Assessment
Class Graph: Before the activity, engage students in a simple exercise to refresh their familiarity with graphs. On the chalk/white board, create a simple table with the following two columns for data: Type of Candy, Number of Students. Then, select five common candies (caution: do not get derailed on candy types; candy type can be as vague as: milk chocolate, dark chocolate, peanut, nougat, suckers, etc.). Finally, poll students, by a show of hands, as to how many students like each of candy type. Then, graph the data, reminding students of basic concepts.
Activity Embedded Assessment
Ball Shooter Graphing Worksheet Observation: During the activity, evaluate students on proper data collection, data organization, and graph interpretation. If done correctly, the data trends acquired from the activity from each group should be very similar. Evaluation of machine performance through data analysis, which is a real-world application of data collection and graphing, is a key concept for students to take away from the activity.
Post-Activity Embedded Assessment
Follow-Up Questions/Discussion: As a class, discuss the trends observed in the data. When plotting the distance vs. power level graph, is it a straight line? Why or why not? What factors contribute to the shape of the line that you see? (The graph is generally not expected to be a straight line; however it is dependent on many factors, such as the build of the machine, air resistance of the projectile, the friction between the projectile and the contact surface of the machine, etc.).
Safety Issues
- Make sure that student fingers do not come too close to the gear train inside the ball shooter set-up.
Troubleshooting Tips
Make sure that the gears in the set-up touch/mesh with each other. Although the design illustrated in the LEGO Digital Designer building instructions may not display a meshing of the gears (due to possible software bugs), the gears in the gear train must be meshed together in order for the wheels to rotate.
The identification and position of the power and angle buttons on the control panel may vary due to the connections. As long as each push button is connected to each of the bottom four ports of the EV3, the connections can be physically moved around to obtain the desired set-up.
Activity Extensions
The robot, as designed, is also on a rotating platform. So students can also collect data and graph the angle of the ball shooter along with horizontal distance data to observe the variation between the two quantities, which can result in a curved parabolic graph depending on the settings. Students may also discuss and find out what would optimize the distance that the ball travels (angle position, power level, etc.).
Subscribe
Get the inside scoop on all things Teach Engineering such as new site features, curriculum updates, video releases, and more by signing up for our newsletter!More Curriculum Like This

Students learn about linear programming (also called linear optimization) to solve engineering design problems. They apply this information to solve two practice engineering design problems related to optimizing materials and cost by graphing inequalities, determining coordinates and equations from ...

Students learn about the first attempts at machine learning and specifically about the perceptron model—a simplified model of a biological neuron.
Copyright
© 2013 by Regents of the University of Colorado; original © 2012 Polytechnic Institute of New York UniversityContributors
Ronald Poveda, Zachary Nishino, Vikram KapilaSupporting Program
AMPS GK-12 Program, Polytechnic Institute of New York UniversityAcknowledgements
This activity was developed under the Applying Mechatronics to Promote Science (AMPS) Program funded by National Science Foundation GK-12 grant no. 0741714. However, these contents do not necessarily represent the policies of the NSF and you should not assume endorsement by the federal government.
Last modified: May 16, 2023


User Comments & Tips