Quick Look
Grade Level: 5 (4-8)
Time Required: 1 hours 30 minutes
(can be split into two 45-minute sessions)
Expendable Cost/Group: US $7.00 This activity also uses non-expendable (reusable) LEGO® MINDSTORMS® EV3 intelligent bricks and color sensors, as well as an erosion table; see the Materials List for details and alternatives.
Group Size: 6
Activity Dependency:
Subject Areas: Earth and Space, Life Science, Physical Science, Science and Technology
NGSS Performance Expectations:

| 5-ESS3-1 |
| MS-ESS3-3 |
Summary
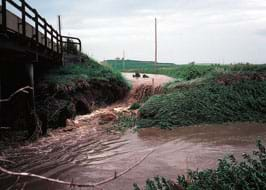
Students learn about contamination and pollution, specifically in reference to soil in and around rivers. To start, groups use color sensors to take light reflection measurements of different colors of sand (dyed with various amounts of a liquid food dye), generating a set of "soil" calibration data. Then, they use a stream table with a simulated a river that has a scattering of "contaminated wells" represented by locations of unknown amounts of dye. They make visual observations and use color sensors again to take reflection measurements and refer to their earlier calibration data to determine the level of "contamination" (color dye) in each well. Acting as engineers, they determine if their measured data is comparable to visual observations. The small-scale simulated flowing river shows how contamination can spread.Engineering Connection
Civil, geotechnical and geo-environmental engineers investigate and mitigate soil and groundwater contamination in order to ensure safe health conditions for people who live nearby. Approximately half the U.S. population obtains its drinking water from groundwater so engineers make sure municipal water is safe to drink. Soil contamination is a topic on the forefront of many environmental conversations, and billions of dollars are required to clean up contaminated soil sites nationwide, such as the 1300+ "superfund" sites in the U.S. In this activity, use of an erosion table and the data collection, calibration, analysis and extrapolation engages students in typical engineering activities, helping them to see the connection between soil contamination and water pollution.
Learning Objectives
After this activity, students should be able to:
- Define pollution, its causes, and the different forms in which it exists.
- Describe the necessity for calibration in science experiments.
- Use a color sensor to make scientific observations.
Educational Standards
Each TeachEngineering lesson or activity is correlated to one or more K-12 science,
technology, engineering or math (STEM) educational standards.
All 100,000+ K-12 STEM standards covered in TeachEngineering are collected, maintained and packaged by the Achievement Standards Network (ASN),
a project of D2L (www.achievementstandards.org).
In the ASN, standards are hierarchically structured: first by source; e.g., by state; within source by type; e.g., science or mathematics;
within type by subtype, then by grade, etc.
Each TeachEngineering lesson or activity is correlated to one or more K-12 science, technology, engineering or math (STEM) educational standards.
All 100,000+ K-12 STEM standards covered in TeachEngineering are collected, maintained and packaged by the Achievement Standards Network (ASN), a project of D2L (www.achievementstandards.org).
In the ASN, standards are hierarchically structured: first by source; e.g., by state; within source by type; e.g., science or mathematics; within type by subtype, then by grade, etc.
NGSS: Next Generation Science Standards - Science
| NGSS Performance Expectation | ||
|---|---|---|
|
5-ESS3-1. Obtain and combine information about ways individual communities use science ideas to protect the Earth's resources and environment. (Grade 5) Do you agree with this alignment? |
||
| Click to view other curriculum aligned to this Performance Expectation | ||
| This activity focuses on the following Three Dimensional Learning aspects of NGSS: | ||
| Science & Engineering Practices | Disciplinary Core Ideas | Crosscutting Concepts |
| Obtain and combine information from books and/or other reliable media to explain phenomena or solutions to a design problem. Alignment agreement: | Human activities in agriculture, industry, and everyday life have had major effects on the land, vegetation, streams, ocean, air, and even outer space. But individuals and communities are doing things to help protect Earth's resources and environments. Alignment agreement: | A system can be described in terms of its components and their interactions. Alignment agreement: Science findings are limited to questions that can be answered with empirical evidence.Alignment agreement: |
| NGSS Performance Expectation | ||
|---|---|---|
|
MS-ESS3-3. Apply scientific principles to design a method for monitoring and minimizing a human impact on the environment. (Grades 6 - 8) Do you agree with this alignment? |
||
| Click to view other curriculum aligned to this Performance Expectation | ||
| This activity focuses on the following Three Dimensional Learning aspects of NGSS: | ||
| Science & Engineering Practices | Disciplinary Core Ideas | Crosscutting Concepts |
| Apply scientific principles to design an object, tool, process or system. Alignment agreement: | Human activities have significantly altered the biosphere, sometimes damaging or destroying natural habitats and causing the extinction of other species. But changes to Earth's environments can have different impacts (negative and positive) for different living things. Alignment agreement: | Relationships can be classified as causal or correlational, and correlation does not necessarily imply causation. Alignment agreement: The uses of technologies and any limitations on their use are driven by individual or societal needs, desires, and values; by the findings of scientific research; and by differences in such factors as climate, natural resources, and economic conditions. Thus technology use varies from region to region and over time.Alignment agreement: |
Common Core State Standards - Math
-
Represent and interpret data.
(Grade
1)
More Details
Do you agree with this alignment?
-
Represent and interpret data.
(Grade
5)
More Details
Do you agree with this alignment?
International Technology and Engineering Educators Association - Technology
-
New products and systems can be developed to solve problems or to help do things that could not be done without the help of technology.
(Grades
6 -
8)
More Details
Do you agree with this alignment?
-
Differentiate between inputs, processes, outputs, and feedback in technological systems.
(Grades
6 -
8)
More Details
Do you agree with this alignment?
State Standards
New York - Math
-
Represent and interpret data.
(Grade
5)
More Details
Do you agree with this alignment?
New York - Science
-
Obtain and combine information about ways individual communities use science ideas to protect Earth's resources and environment.
(Grade
5)
More Details
Do you agree with this alignment?
-
Apply scientific principles to design a method for monitoring and minimizing a human impact on the environment.
(Grades
6 -
8)
More Details
Do you agree with this alignment?
Materials List
This activity was designed for classrooms with access to an erosion table. However, if unavailable, instructions are provided below for alternate materials.
Each group needs:
- LEGO EV3 Intelligent Brick (such as part #45500 for $197.99, available at https://shop.lego.com/en-US/EV3-Intelligent-Brick-45500)
- LEGO MINDSTORMS EV3 Color Sensor, available at https://shop.lego.com/en-US/EV3-Color-Sensor-45506 for $41.99
- 8 clear plastic cups, 8-ounce size or larger; 1 empty, 1 for water, 1 for sand and 5 for different contaminated sand samples that are labeled and prepared with drops of dye
- 6 plastic spoons; 1 for each of the 5 contaminated sand samples plus 1 for adding sand and water
- Soil Contamination Pre-Evaluation, one per student
- Soil Contamination Post-Evaluation, one per student
- Soil Contamination Worksheet, one per student
To share with the entire class:
- simulation of river flow, via an erosion table with hydraulic bench OR a stream table OR a homemade erosion table; see below for details about these options
- 10 pounds fine sand (~$5)
- roll of aluminum wire mesh, 7 feet in length such as this New York Wire 24-in (61 cm) wide aluminum screening at https://www.zoro.com/phifer-screen-bright-aluminum-24in-w-x-100ft-l-3000727/i/G9554736/?q=New+York+Wire+24-in+wide+aluminum+screening
- heavy-duty scissors or tin snips, to cut wire mesh
- permanent marker, to write on plastic cups
- box of liquid food color dye ($9), such as https://www.amazon.com/MCCORMICK-FOOD-AND-COLORING-Colors/dp/B004G7PLJI/ref=sr_1_2?ie=UTF8&qid=1401487149&sr=8-2&keywords=food+coloring+mccormick%20OR%20http://www.amazon.com/McCormick-486204917497-Mccormick-Color-1-Ounce/dp/B006K3RKEU/ref=pd_sim_gro_3?ie=UTF8&refRID=1GPATVZ1NK8VJCQM4ATX
- access to water and sink
River Simulation Options
- Erosion table with hydraulic bench for academic purposes, such as the Hydro-Geology Stream Table - Hubbard (#Z06394M) for $1,330 from Nasco at https://www.enasco.com/p/Z06394M; the recommended table dimensions are 26-in wide X 66-in long X 6-in deep; the author used the erosion table shown in Figure 1.
- Alternatively, use a stream table, such as, such as the Stream Table Kit (#SB01704M) for $80 from Nasco at https://www.enasco.com/p/SB01704M; its heavy plastic tray is 14-in wide X 48-in long X 3-in deep with a drain hole.
- Alternatively, create a homemade erosion table, such as the one shown in Figure 4. Although a bit more work, it is an efficient low-cost alternative that can be created for ~$34 using the following supplies:
- a large plastic box of similar dimensions to the erosion and stream tables; manually create a drain (hole) on one end, such as this 16.25-in wide X 23-in long X 6-in deep 28-quart storage bin for ~$7 at http://www.homedepot.com/p/Sterilite-28-Qt-Latch-Box-16551010/100671079
- a second pan or bucket to collect the water, such as a five-gallon bucket for ~$3
- a filter, such as a piece of cheesecloth, to keep soil from escaping the pan, ~$4
- a pump, with velocity or flow meter if possible, so students can observe differences in erosion effects due to flow rate changes, ~ $20
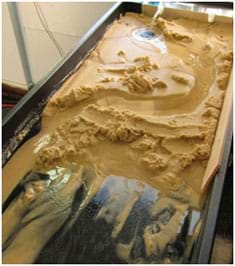
Figure 1. The erosion table used in this activity, filled with fine sand.
Worksheets and Attachments
Visit [www.teachengineering.org/activities/view/nyu_soil_activity1] to print or download.Pre-Req Knowledge
This activity is intended to be taught after conducting the Erosion in Rivers and Sensing Your Surroundings activities.
Introduction/Motivation
Many types of engineers, especially geotechnical and geo-environmental engineers, study the way soil and groundwater interact with each other. These engineers must know and understand the composition of the soil, including how much water is present in the soil, the type of soil, and if any objects are in the soil that do not belong.
Do you recall—what are the four types of soil? (Listen to student answers.) They are clay, silt, sand and gravel. And what are the three phases, or parts of soil? (Listen to student answers.) They are solid, water and air. The air and water exist within voids, or pockets, in the solid soil.
Imagine you have an empty glass jar, a handful of marbles and a cup of water. If you fill the jar with marbles, space still exists between the marbles and the space is filled with air. Those spaces are what we call the voids or pockets. Now imagine that you pour a cup of water into the jar, filling the jar halfway. Now three phases of matter are present in the jar: gas (air), liquid (water) and solid (marbles). If we imagine that the marbles represent pieces of solid soil; the water represents groundwater, and the empty spaces are the air pockets, or voids, then our imaginary jar of marbles becomes just like a soil sample, illustrating the typical composition of soil.
The U.S. Environmental Protection Agency (EPA) is a government organization that regulates and controls health hazards located near and around where people live. In 2012 in the U.S., the EPA stated that Americans produced about 251 million tons of waste (see Figure 2). (Either draw the Figure 2 pie chart on the classroom board, or read off the pie piece components to the class.) The 251 million tons of waste is the total amount of garbage produced before recycling. If we consider yard trimmings as essentially soil, why is yard trimmings, at 13.5% of all the waste, such a large percentage?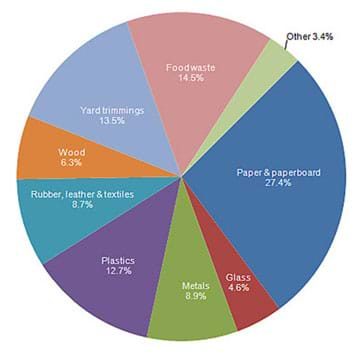
Soil is often considered waste or garbage, for two reasons. First, soil is considered waste because sometimes it is no longer needed. For example, in large construction projects or even minor home projects, including mowing the lawn, gardening and landscaping, yard trimmings or other forms of soil waste are produced. In these cases, the soil is not considered dirty, or polluted, but it is thrown away because no space is available to store large amounts of excavated soil from large construction projects.
One example in which a large amount of unwanted soil was creatively used was during the World Trade Center construction in Lower Manhattan, NY during the 1970s. During this project, an enormous amount of soil was taken out of the ground to make room for the new skyscrapers. In order to recycle that soil from the excavation, it was used as fill material to build up part of Battery Park City.
The second reason soil is sometimes considered garbage is because soil can become polluted. If excavated soil is determined to be polluted, it is relocated to a landfill, as if it was trash. A landfill is an engineered location where waste is placed underground and isolated so it cannot further pollute the surrounding soil or groundwater. People use landfills to deposit waste; they are where trash that is not recycled ends up.
Soil contamination is a big concern because about half of all Americans get their water from (underground) groundwater—so we do not want the soil that contains our future drinking water to be contaminated. If soil becomes contaminated, meaning chemicals and materials not naturally found in soil are present, then geo-environmental engineers test the soil and the water it contains to determine if they are polluted. Some contaminants are hazardous and some are not. Hazardous contaminants include petroleum products, pesticides, herbicides, fungicides, discarded commercial products and medicines, and cleaning and degreasing chemicals. Non-hazardous contaminants include mostly municipal solid waste and industrial waste, such as material byproducts from the production of goods.
Pollution occurs once contamination is found to be at a level that is considered harmful to human health. As the population grows, so does waste. Many environmental engineers are involved in figuring out the causes and consequences of air and water pollution, and then finding ways to clean it up. Any of the three parts of soil—solid, air, water—can become contaminated. In 2012, the Environmental Resource Center reported the EPA estimate that at least $110 billion dollars is still needed to clean up at least 126,000 contaminated groundwater sites across the country. 
Soil can become polluted in several ways. Most soil contamination comes from past, unregulated industrial waste disposal. That means, in the past, factories dumped their trash or waste materials directly into nearby soil or water sources. If waste is dumped into water, contaminants often sink into the soil below the water, further spreading contamination. Agricultural sources of soil contamination include livestock waste, fertilizers, herbicides and pesticides. At gas stations, big underground tanks store gasoline. Leaking underground gasoline storage tanks, septic systems and landfills are also responsible for soil contamination and pollution. Mining also leads to soil pollution.
Today's activity is composed of two parts: the calibration and the experiment. First, we perform a calibration to tell us how the computer sees different colors of known amounts of dye. For example, with your eye, you can see shades of red, from pink to fire hydrant red. However, computers, or robots do not see that way. In fact for a computer to "see," it must use a sensor—in this case, we use a color sensor to detect color by measuring reflected light.
Imagine wearing a black shirt and then a white shirt on a hot, sunny summer day. Does the black shirt reflect or absorb light? What about the white shirt? How do you know? (Listen to student answers.) Black absorbs light (and heat) while white reflects heat. That is why you feel hotter when you wear a black shirt than when you wear a white shirt.
A color sensor works in a similar way. Since lighter colors reflect more light, the sensor measures the amount of reflected light in order to figure out which color, or shade of color, something is.
What are other examples of calibration? (See if students have any ideas.) One example of a calibration is a smart board. Maybe you have used one before. Sometimes when you write on the board, the writing appears away from where you place the pen. This is an indication that the smart board needs to be calibrated. Calibration is giving the computer a known reference point. When calibrating the smart board, a set of dots appears on the screen. To calibrate the smart board, you use the pen to tell the smart board where those reference dots are located.
Once you have completed today's calibration, you will know what percentage of reflected light corresponds to what color—a specific number of drops of dye. Then you can construct a small-scale river simulation, placing wells along the river. A well is a large, deep hole in the ground that can be used to pump water out, or in, or as a way to take a look at the soil or groundwater below. From a sampling well, researchers extract soil samples that they analyze in laboratories. In our soil contamination activity, dye represents contamination. You will refer to your calibration to determine how much contamination (or dye) exists in each well. The simulated flowing river shows how contamination can spread due to both groundwater flow and surface water flow.
Procedure
Before the Activity
Gather materials and make copies of the Soil Contamination Pre-Evaluation, Soil Contamination Worksheet and Soil Contamination Post-Evaluation, one each per student.
This activity is composed of two experimental parts.
Part 1: Soil Contamination Calibration
- For each group, prepare 5 plastic cups containing 2, 4, 6, 8 and 10 drops of liquid food color dye, respectively. Use a permanent marker to label each cup with the number of drops of dye. Students will later add water and sand to the cups.
- For each group, also provide 1 empty cup labeled "clean" or "uncontaminated," 1 cup of sand and 1 cup of water.
Part 2: Soil Contamination in Rivers Experiment
- From the options presented in the Materials List, decide and prepare a classroom river simulation. Depending on time available and student level, determine how involved to have students in preparing the river simulation and wells.
- Construct 6 wells by cutting and forming pieces of the aluminum wire mesh; scatter them near the simulated river (see Figure 4).
- Place color dye at the beginning of the river and, if you wish, in other locations near the river (see Figure 4).
- For each group, put together an EV3 robot with color sensor. Test the EV3 intelligent bricks and EV3 color sensors before conducting the activity. Make sure the color sensors are connected to port 1.
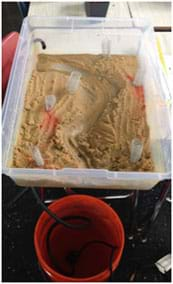
Figure 4. Soil Contamination in Rivers experimental setup.
With the Students
- Administer the pre-activity evaluation, having students work independently to answer the questions.
- Present to the class the content in the Introduction/Motivation section about waste, pollution and soil contamination. Explain any new vocabulary terms. As a class, review the answers to the pre-evaluation before beginning the experiments.
- Ask students to brainstorm possible ways that pollution can occur. Challenge them to think on a large scale, instead of a personal level. Have students record their answers and ideas on paper.
Part 1: Soil Contamination Calibration
- Divide the class into groups of about six students each.
- Give each group a set of 5 prepared cups with dye, 1 cup of clean dry sand, 1 cup of water, 1 cup of sand, spoons, and an EV3 brick equipped with a color sensor connected to port 1.
- Direct students to use 1 spoon to add 10 ml (~10 spoonfuls) of sand and 5 ml (~5 spoonfuls) of water. The objective is to have a red, wet, not watery, sand sample, for each "contaminated" sample. Advise students to be consistent in their sand and water spoon measurements. Have students use spoons to mix the contents in the cups; using a different spoon for each of the 5 contaminated samples—being careful not to cross contaminate.
- Direct students to use the View command (View > Reflected Light > Port 1) on the EV3 brick to measure the percentage of reflected light for each of the 6 samples (clean sand and 5 contaminated sand samples). Student tips to obtain the most accurate data:
- Record reflection values while placing the color sensor as close to the sand as possible, and perpendicular to the sand surface.
- Be aware that ambient light conditions dramatically affect the sensor so make sure to run the calibration and experiment in the same location with the same general light conditions.
- Have students record the calibration data in the third column of worksheet Table 1 titled, Percentage of Reflection. Inform students that these numbers are very important for Part 2, the experiment.
- Have students double check to make sure all cells are filled with data in worksheet Table 1. Students can also compare answers with group mates.
- Collect the 6 calibration samples from each group and set them aside.
Part 2: Soil Contamination in Rivers Experiment
- Show students the small-scale river simulation and wells. Talk about the purpose of simulations and how they give researchers a way to experiment and study about real-world situations. Run the river simulation. Then give students a few minutes to sketch on their worksheets the experimental setup.
- Direct teams to use their color sensors and EV3 bricks to measure reflected light within each of the wells around the simulated river. Then in worksheet Table 2, record the percentage of reflection (column 1) and visual observations of its sand (column 2) for each well.
- Working as if they were engineers, have students decide how many drops of contamination (based on their calibration experiment results) they estimate are in each of the wells. To do this, they use the known calibration data to estimate the number of drops of dye in each well. As necessary, help them by suggesting they compare the numbers in the Percentage of Reflection columns in Table 1 and Table 2, comparing the experimental data with their calibration data. If the numbers do not match exactly, extrapolate to make a best guess.
- Give students time to work independently to complete the three long-answer questions to finish up the worksheet.
- Lead a class discussion so students can share, compare and consider the answers to the worksheet questions. Also ask them the four additional questions provided in the Assessment section.
- Conclude by administering the post-quiz (same as the pre-quiz) to gauge student comprehension.
Vocabulary/Definitions
calibration: A way to find a known reference point, or set of points.
contamination: Something present that does not belong.
excavation: A large engineered hole, often created to make room for a new building structure or to remove unwanted soil.
groundwater: Water flowing under the ground, through the soil.
hazardous: Potentially harmful.
landfill: An engineered location at which waste is placed underground and isolated so it cannot contaminate the surrounding soil or groundwater.
pollution: Contamination that is harmful, or hazardous, to human health.
simulation: Using a model to replicate the behavior of some real-life situation or process, especially for the purpose of study or experimental testing.
well: A large, deep hole in the ground, often created to access water, sample soil or observe the soil and groundwater below.
Assessment
Pre-Activity Assessment
Pre-Quiz: Administer the eight-question Soil Contamination Pre-Evaluation to assess students' prior knowledge about soil, soil contamination and pollution, waste, calibration and wells. Administer the same quiz as a post-activity assessment.
Activity Embedded Assessment
Data Collection and Analysis: As students work through the activity, have them complete the Soil Contamination Worksheet, which includes sketching the location of the river and wells, recording data from the calibration experiment, and recording and analyzing data from the experiment to determine the level of pollution in each well.
Post-Activity Assessment
Discussion Questions: After students have individually written answers to the three questions at the end of the Soil Contamination Worksheet, lead a class discussion so students can share their responses. The worksheet questions are provided below, as well as four additional questions/answers.
- Do your visual observations match the number of drops you calculated? How confident are you of any extrapolated answers? (Answers and explanations will vary.)
- What are possible sources of error? (Possible answers: Inconsistent lighting conditions, incorrect sensor use, incorrect calibration data.)
- How might you improve this experiment for next time? (Answers will vary. Possible answers: Increase the calibration scale to be able to fine tune the number of dye drops; measure the ambient light conditions and make a data adjustment if light conditions change during the course of the experiment.)
- Why might it be important for engineers to identify how contaminated each well is? (Answer: Based on the amount of contamination present, engineers decide if that amount is harmful to human health, also known as pollution, or not. The U.S. EPA publishes data that states the acceptable levels of contamination. For example, just because, arsenic is present does not mean that remediation is necessary. The allowable limit of arsenic in drinking water is 10μg/l. So, if arsenic contamination is present but only in the amount of 5μg/l, it is not legally in need of remediation.)
- What should engineers do if they identify wells that are extremely polluted? Or only slightly polluted? (Answer: If contamination levels are higher than acceptable amounts, engineers report it and make sure that cleanup, or remediation, occurs. If contamination levels are less than the acceptable amounts, engineers can opt to not perform remediation.)
- Is it important to know how close a polluted well is to a river? Why or why not? (Answer: Yes, it is important to know how close polluted wells are to nearby bodies of water because they can affect groundwater. Thus, river flow can affect the movement of contamination. Some rivers are effluent, which means that they obtain their water from groundwater. Therefore, if contamination is found in a well that is near an effluent river, a high risk exists that contamination could spread into the river, creating a much larger problem.)
- Is a color sensor a plausible real-world option for detecting contamination? What about a well? (Answer: Perhaps not the color sensors we used today, but a variety of imaging techniques are used to detect contamination. Often, x-ray techniques are used to analyze the subsurface. Soil samples are extracted from sampling wells and then analyzed for contamination in laboratories.)
Post-Quiz: Administer the eight-question Soil Contamination Post-Evaluation (same as the pre-activity assessment). Compare pre/post answers to assess students' change in understanding about soil, soil contamination and pollution, waste, calibration and wells.
Activity Scaling
For lower grades, it is helpful to use pre-made sand samples (perhaps prepared by older students) for the calibration portion of the activity in order to maintain focus and avoid distraction. Also, consider adapting or skipping the pre- and post-evaluations. Instead, hold an in-depth class discussion about soil contamination and the role of engineers in protecting the public by identifying and cleaning up hazardous contaminations.
Subscribe
Get the inside scoop on all things Teach Engineering such as new site features, curriculum updates, video releases, and more by signing up for our newsletter!More Curriculum Like This

In this lesson, students learn about the three methods of waste disposal in use by modern communities. They also investigate how engineers design sanitary landfills to prevent leachate from polluting the underlining groundwater.

Students learn how water flows through the ground, what an aquifer is, and what solid properties predict groundwater flow. Groundwater is one of the largest sources of drinking water, so environmental engineers need to understand groundwater flow in order to tap into this important resource.
References
EPA Could Regulate Drilling Waste. Posted 11/12/2012. View Tip, Environmental Resource Center, Cary, NC. Accessed June 2, 2014. http://www.ercweb.com/resources/viewtip.aspx?id=7935
Municipal Solid Waste. Last updated 2/28/2014. Wastes > Non-Hazardous Waste > Municipal Solid Waste, U.S. Environmental Protection Agency. Accessed June 2, 2014. http://www.epa.gov/waste/nonhaz/municipal/
Copyright
© 2014 by Regents of the University of Colorado; original © 2014 Polytechnic Institute of New York UniversityContributors
Sophia MercurioSupporting Program
AMPS GK-12 Program, Polytechnic Institute of New York UniversityAcknowledgements
This activity was developed by the Applying Mechatronics to Promote Science (AMPS) Program funded by National Science Foundation GK-12 grant no. 0741714. However, these contents do not necessarily represent the policies of the NSF, and you should not assume endorsement by the federal government.
Last modified: August 8, 2018





User Comments & Tips