
Quick Look
Grade Level: 2 (1-3)
Time Required: 45 minutes
(split into two 25-minute sessions)
Expendable Cost/Group: US $3.00
Group Size: 2
Activity Dependency: None
Subject Areas: Biology, Life Science, Problem Solving, Reasoning and Proof
NGSS Performance Expectations:

| K-2-ETS1-1 |
| K-2-ETS1-2 |
| K-2-ETS1-3 |
Quick Look

- Grade Level:
- 2 (1 – 3)
- Time Required:
- 45 minutes
(split into two 25-minute sessions)
- Group Size:
- 2
- Subject Areas:
-
Biology Life Science Problem Solving Reasoning and Proof -
NGSS Performance Expectations:
K-2-ETS1-1 K-2-ETS1-2 K-2-ETS1-3
Summary
By studying how bees and flowers interact with one another, we can also understand engineering practices related to our environment! In this activity, students engineer a model of a flower to test different materials’ ability to pollinate another flower. In teams of two, students use the engineering design process to create a model of a flower out of construction paper and then test different materials by measuring and recording how much pollen is transferred. While discovering the most efficient material, students determine how the information they gain can help bees pollinate and they better understand the importance of bee conservation.
Engineering Connection
Engineers use various materials in design and construction in virtually every aspect and specialty. When working with conservation efforts, engineers specialize in designing systems and practices that protect the environment and natural resources. Responsible use and sustainability are both intertwined with engineering. Environmental engineers work with different materials to best preserve and assist natural occurring processes, such as pollination, that benefit the environment.
Learning Objectives
After this activity, students should be able to:
- Explain the process of pollination and its importance to the environment.
- Plan collaboratively.
- Understand the importance of models and how to build one.
- Understand the engineering design process and why it is used.
- Collect data by taking measurements and putting that information into a bar graph to be analyzed.
- Complete multiple trials using varying iterations to find optimal results.
Educational Standards
Each Teach Engineering lesson or activity is correlated to one or more K-12 science,
technology, engineering or math (STEM) educational standards.
All 100,000+ K-12 STEM standards covered in Teach Engineering are collected, maintained and packaged by the Achievement Standards Network (ASN),
a project of D2L (www.achievementstandards.org).
In the ASN, standards are hierarchically structured: first by source; e.g., by state; within source by type; e.g., science or mathematics;
within type by subtype, then by grade, etc.
Each Teach Engineering lesson or activity is correlated to one or more K-12 science, technology, engineering or math (STEM) educational standards.
All 100,000+ K-12 STEM standards covered in Teach Engineering are collected, maintained and packaged by the Achievement Standards Network (ASN), a project of D2L (www.achievementstandards.org).
In the ASN, standards are hierarchically structured: first by source; e.g., by state; within source by type; e.g., science or mathematics; within type by subtype, then by grade, etc.
NGSS: Next Generation Science Standards - Science
| NGSS Performance Expectation | ||
|---|---|---|
|
K-2-ETS1-1. Ask questions, make observations, and gather information about a situation people want to change to define a simple problem that can be solved through the development of a new or improved object or tool. (Grades K - 2) Do you agree with this alignment? |
||
| Click to view other curriculum aligned to this Performance Expectation | ||
| This activity focuses on the following Three Dimensional Learning aspects of NGSS: | ||
| Science & Engineering Practices | Disciplinary Core Ideas | Crosscutting Concepts |
| Ask questions based on observations to find more information about the natural and/or designed world(s). Alignment agreement: Define a simple problem that can be solved through the development of a new or improved object or tool.Alignment agreement: | A situation that people want to change or create can be approached as a problem to be solved through engineering. Alignment agreement: Asking questions, making observations, and gathering information are helpful in thinking about problems.Alignment agreement: Before beginning to design a solution, it is important to clearly understand the problem.Alignment agreement: | |
| NGSS Performance Expectation | ||
|---|---|---|
|
K-2-ETS1-2. Develop a simple sketch, drawing, or physical model to illustrate how the shape of an object helps it function as needed to solve a given problem. (Grades K - 2) Do you agree with this alignment? |
||
| Click to view other curriculum aligned to this Performance Expectation | ||
| This activity focuses on the following Three Dimensional Learning aspects of NGSS: | ||
| Science & Engineering Practices | Disciplinary Core Ideas | Crosscutting Concepts |
| Develop a simple model based on evidence to represent a proposed object or tool. Alignment agreement: | Designs can be conveyed through sketches, drawings, or physical models. These representations are useful in communicating ideas for a problem's solutions to other people. Alignment agreement: | The shape and stability of structures of natural and designed objects are related to their function(s). Alignment agreement: |
| NGSS Performance Expectation | ||
|---|---|---|
|
K-2-ETS1-3. Analyze data from tests of two objects designed to solve the same problem to compare the strengths and weaknesses of how each performs. (Grades K - 2) Do you agree with this alignment? |
||
| Click to view other curriculum aligned to this Performance Expectation | ||
| This activity focuses on the following Three Dimensional Learning aspects of NGSS: | ||
| Science & Engineering Practices | Disciplinary Core Ideas | Crosscutting Concepts |
| Analyze data from tests of an object or tool to determine if it works as intended. Alignment agreement: | Because there is always more than one possible solution to a problem, it is useful to compare and test designs. Alignment agreement: | |
Common Core State Standards - Math
-
Reason abstractly and quantitatively.
(Grades
K -
12)
More Details
Do you agree with this alignment?
-
Represent and interpret data.
(Grade
2)
More Details
Do you agree with this alignment?
-
Draw a scaled picture graph and a scaled bar graph to represent a data set with several categories. Solve one- and two-step "how many more" and "how many less" problems using information presented in scaled bar graphs.
(Grade
3)
More Details
Do you agree with this alignment?
State Standards
Florida - Math
-
Reason abstractly and quantitatively.
(Grades
K -
12)
More Details
Do you agree with this alignment?
-
Draw a picture graph and a bar graph (with single-unit scale) to represent a data set with up to four categories. Solve simple put-together, take-apart, and compare problems using information presented in a bar graph.
(Grade
2)
More Details
Do you agree with this alignment?
Materials List
Each group needs:
- Flower model
- 4 sheets of tissue paper or construction paper (for flower petals)
- pipe cleaner (for flower stem)
- scissors
- tape (masking, Scotch, painters)
- Pollen
- paper bowl (to hold the “pollen” – cheese puffs)
- 3-4 cups of cheese puffs (one for each design iteration and test)
- Materials to test
- 2 strips of Velcro, ~75mm to 100 mm long
- 2 wooden popsicle sticks
- square of tin foil, 50 mm x 50 mm
- sponge (cut in half)
- (optional) square of felt, 50 mm x 50 mm
- 2 craft sticks
- 2 rubber bands
- poster paper or large Post-It notes
- 2-3 pairs of latex gloves, one per student
- crayons or colored markers
- Pollen Collection Data Worksheet, one per student
- Pre-Assessment, one per student
- Post-Assessment, one per student
For the entire class to share:
- markers
- balance scale
Worksheets and Attachments
Visit [www.teachengineering.org/activities/view/uof-2627-pollinate-flower-materials-design] to print or download.Pre-Req Knowledge
- Basic understanding of bee pollination and plant parts.
- Familiarity with gathering data to put into a bar graph.
Introduction/Motivation
Raise your hand: who likes to eat fruit? What are some of your favorite kinds of fruit to eat? (Let students raise their hand to share their favorite fruits.) Do you know that pollen and the process of pollination are needed to produce these yummy fruits? What is pollination? What are some ways it gets accomplished? Can you think of some insects that pollinate flowers?
One insect that is critical in pollination is the honeybee, which is what makes all our food production possible. Honeybees pollinate billions of dollars’ worth of crops each year, including more than 130 different kinds of fruits and vegetables. Managed honeybees are vital to American agriculture because they pollinate a wide variety of crops, contributing to food diversity, security, and profitability. There is a huge problem, however, because over the course of the past 50 years the bee population has declined. Beehives are collapsing due to disease, pesticides, and poor nutrition. In fact, research shows that bees are disappearing at rates that are “consistent with mass extinction” and could be gone within a few decades. Conservation efforts are underway that include planting cover crops, planting wildflowers and native grasses in buffer areas and areas not in production, and improving management of grazing lands.
What is another way we can help honeybees? Yes, we can help by finding ways to aid in their job of pollination. A bee gathers pollen its whole life by landing on flowers and collecting it on their legs. They then travel to other flowers, usually of the same kind, and deposit the pollen to that flower and so on. Many plants require this kind of pollen distribution, known as cross-pollination, to produce viable seeds. The business of collecting pollen requires a lot of energy, and so many flowers attract and reward bees with nectar, a mixture of water and sugars produced by plants.
Ecological engineering uses ecology and engineering to predict, design, construct or restore, and manage ecosystems that integrate "human society with its natural environment for the benefit of both.” If we can figure out how to effectively transfer pollen on to the bee, we can design and build something to help bees pollinate even more flowers.
So, today we will build a model of a flower and simulate pollen using cheese puffs. We will test various materials by collecting pollen with each and measuring/analyzing the samples. From there we will design and engineer a tool to help bees collect and disperse pollen using some of the steps of the engineering design process.
Procedure
Background
How do bees pollinate flowers? Bees make excellent pollinators because most of their life is spent collecting pollen, a source of protein that they feed to their developing offspring. When a bee lands on a flower, the hairs all over the bees' body attract pollen grains through electrostatic forces. Stiff hairs on their legs enable them to groom the pollen into specialized brushes or pockets on their legs or body, and then carry it back to their nest. Individual bees tend to focus on one kind of flower at a time, which means it is more likely that pollen from one flower will be transferred to another flower of the same species by a particular bee. Many plants require this kind of pollen distribution, known as cross-pollination, to produce viable seeds. The business of collecting pollen requires a lot of energy, and so many flowers attract and reward bees with nectar, a mixture of water and sugars produced by plants. Choose from one or more of the following videos for visuals and more background information:
- Virtual Farm Field Trip: Pollination (Read Aloud "Bea's Bees) - https://www.youtube.com/watch?v=55VBECuEnLE
- Busy Bees - https://www.youtube.com/watch?v=ta154f5Rp5Y
- Like Fruit? Thank a Bee - https://www.youtube.com/watch?v=txv2k7OoY7U
Before the Activity
- Give each student a Pre-Assessment. Have them do the pre-assessment.
- Gather materials and make copies (or have students copy in science journals) of the Pollen Collection Data Worksheet.
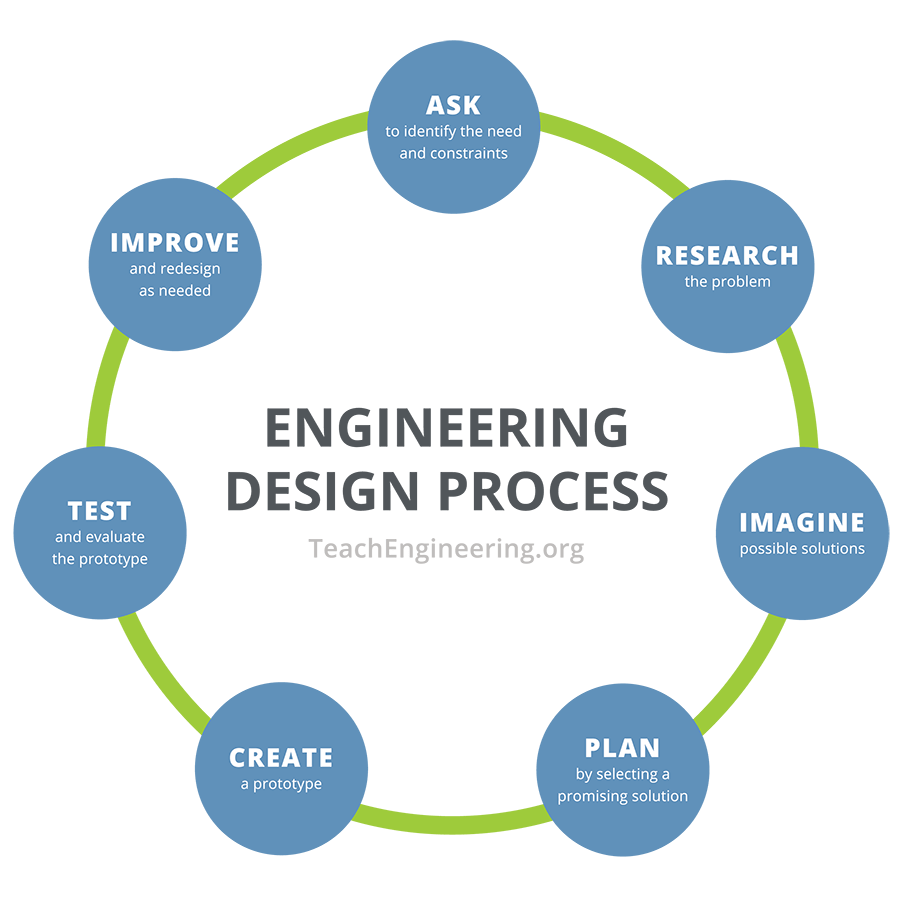
- Show the diagram of the engineering design process to the students and explain that it is a process that engineers follow when they are designing a new product, process, or system.
Day 1
With the Students
- Divide the class into teams of two or three students.
- Hand out the group materials and worksheets.
- Give students 5 minutes to imagine and brainstorm how they will make a flower out of the available materials: tissue paper (or construction paper) and pipe cleaner using scissors and tape or glue.
- Have students create their flower model out of the tissue paper (or construction paper) and pipe cleaner using scissors and tape or glue.

- Direct the groups to put the simulated pollen (1 cup of cheese puffs) in their paper bowl and set it in the middle of their flower.
- Have students pick the first material they want to test (e.g., Velcro, wooden Popsicle stick, tin foil, or sponge).
- To test their first material:
- Students swirl their testing material around the bowl of cheese puffs one time. Their material will pick up no, little, some, a lot of the cheese ball “cheese” which represents the pollen. (Note: It helps if the teacher models this step for the students.)
- Once the testing material has been swirled around the bowl once, students take their material with “pollen” on it to the balance scale and gently shake it off so the “pollen” falls onto the scale. They should measure the amount of “pollen” in grams.
- They should record the weight of the “pollen” in the chart on the Pollen Collection Data Worksheet.
- Students should repeat steps a. through c. with each material.
- Each group then organizes their data into a bar graph and determines which type of material collects the most pollen.
- Have brief class discussion about their findings. Why do some materials pick up the pollen easier than others?
Day 2
With the Students
- Put students into teams of 2-3 and hand out the materials to build their tool or device.
- Give each student a Pollination Worksheet.
- (Imagine) Give students 5 minutes to individually draw or write down their ideas in the Brainstorming section of the worksheet for tools or devices that could help the bees pollinate flowers using only the materials available. (Let the students be as creative as they want in their brainstorming.)
- Give students 5 minutes to share their brainstorming ideas with their team.
- (Plan) Have each team pick ONE design to create and test. They should draw a picture of their planned device in the Design section of the worksheet. They should use different colors or carefully label the different materials they want to use.
- (Create) Have students create their tool or device out of the available materials.
- (Test) Let students test their devices by swirling it around the bowl of cheese puffs one time. They should then take their tool or device with the “pollen” on it to the balance scale and gently shake it off so the “pollen” falls onto the scale. They should measure and record the amount of “pollen” in grams.

- (Improve) Have students draw a picture or write how they will change their device to collect more pollen.
- (Optional, if time) Let student improve upon their designs and retest as they did for their initial design.
- Have brief class discussion about their findings.
Vocabulary/Definitions
bar graph: A graph in the form of boxes of different heights, with each box representing a different value or category of data, and the heights representing frequencies.
conclusion: A statement based on experimental measurements and observations.
conservation: Act of preserving, guarding, or protecting; the keeping (of a thing) in a safe or entire state.
data: A collection of information, especially in a scientific or computational context, or with the implication that it is organized.
pollen: A powder, produced by the male part of a flower, that causes the female part of the same type of flower to produce seeds.
pollinate: To apply pollen to a flower.
Assessment
Pre-Activity Assessment
Pre-Assessment: Have students complete the Pre-Assessment.
Activity Embedded (Formative) Assessment
Data Collection: Students complete the Pollen Collection Data Worksheet and create a bar graph.
Post-Activity (Summative) Assessment
Post-Assessment: Have students complete the Post-Assessment.
Safety Issues
- Remind students not to eat the cheese puffs that they are using for the activity.
- Provide alternate gloves or materials if any students have allergies to latex or any other materials being tested.
Activity Scaling
- For lower grades, pre-cut the flower petals.
- For upper grades, use rulers to measure the flower and pollen to bring more math into the activity.
Subscribe
Get the inside scoop on all things Teach Engineering such as new site features, curriculum updates, video releases, and more by signing up for our newsletter!More Curriculum Like This

Students gain an understanding of the parts of a plant, plant types and how they produce their own food from sunlight through photosynthesis. They learn how plants play an important part in maintaining a balanced environment in which the living organisms of the Earth survive. This lesson is part of ...

Students learn how the process of soil solarization is used to pasteurize agricultural fields before planting crops. In preparation for the associated hands-on activity on soil biosolarization, students learn how changing the variables involved in the solarizing process (such as the tarp material, s...

Copyright
© 2021 by Regents of the University of Colorado; original © 2021 University of FloridaContributors
Chelsey Simmons, PI, University of Florida MRET Program; Ryan Pacheco, 1st grade classroom teacherSupporting Program
Multidisciplinary Research Experiences for Teachers of Elementary Grades, Herbert Wertheim College of Engineering, University of FloridaAcknowledgements
This curriculum was based upon work supported by the National Science Foundation under RET grant no. EEC 1711543— Engineering for Biology: Multidisciplinary Research Experiences for Teachers in Elementary Grades (MRET) through the College of Engineering at the University of Florida. Any opinions, findings, and conclusions or recommendations expressed in this material are those of the authors and do not necessarily reflect the views of the National Science Foundation.
Last modified: April 7, 2022
User Comments & Tips