Quick Look
Grade Level: 10 (9-11)
Time Required: 2 hours 45 minutes
(three 55-minute periods over three days)
Expendable Cost/Group: US $3.00
Group Size: 2
Activity Dependency: None
Subject Areas: Science and Technology
NGSS Performance Expectations:

| HS-PS1-3 |
Summary
Students investigate the property dependence between liquid and solid interfaces and determine observable differences in how liquids react to different solid surfaces. They compare copper pennies and plastic "coins" as the two test surfaces. Using an eye dropper to deliver various fluids onto the surfaces, students determine the volume and mass of a liquid that can sit on the surface. They use rulers, scales, equations of volume and area, and other methods of approximation and observation, to make their own graphical interpretations of trends. They apply what they learned to design two super-surfaces (from provided surface treatment materials) that are capable of holding the most liquid by volume and by mass. Cost of materials is a parameter in their design decisions.
Engineering Connection
In the field of heat transfer; mechanical, chemical and electrical engineers all work to increase the amount of heat that can be removed from surfaces. Maintaining a certain temperature on a surface is critical, especially in preventing circuit burnout in electronics such as computers, satellites and lasers. In many cases, engineers enhance heat transfer by coating surfaces with liquids. In those cases, the amount of liquid used and the nature of the liquid-solid interface are critical for successful designs. For example, too little contact between a liquid and solid can decrease, instead of increase, the heat removal. Engineers contribute their individual specializations to design challenges. If the goal is to improve heat transfer rates in electrical systems, a mechanical engineer may study the heat transfer through a heated surface using temperature measurements so as to be able to provide improvements to the design (construction). A chemical engineer may understand how materials properties affect the heat transfer through a heated surface and be able to provide improvements to the materials. And an electrical engineer may understand the effect that changing the heat transfer material has on the performance or efficiency of the electronics.
Learning Objectives
After this activity, students should be able to:
- Follow procedures to collect data while changing more than one variable.
- Represent measured data graphically and be able to explain in their own words what the graphical data means.
- Provide supported reasoning for final design recommendations using engineering concepts, such as surface tension is a changing property (soapy, salty, pure water), solid-liquid interface (smooth vs. rough).
Goals:
- Math competency: Skills and appreciation for data collection and analysis used in real life.
- Quantitative literacy: Ability to follow procedures and provide recommendations.
- Engineering applications: Engineering design process, material selection and cost considerations.
- Cultural relevancy: Follow procedures, collaborative work in small groups and hands-on activities.
Educational Standards
Each TeachEngineering lesson or activity is correlated to one or more K-12 science,
technology, engineering or math (STEM) educational standards.
All 100,000+ K-12 STEM standards covered in TeachEngineering are collected, maintained and packaged by the Achievement Standards Network (ASN),
a project of D2L (www.achievementstandards.org).
In the ASN, standards are hierarchically structured: first by source; e.g., by state; within source by type; e.g., science or mathematics;
within type by subtype, then by grade, etc.
Each TeachEngineering lesson or activity is correlated to one or more K-12 science, technology, engineering or math (STEM) educational standards.
All 100,000+ K-12 STEM standards covered in TeachEngineering are collected, maintained and packaged by the Achievement Standards Network (ASN), a project of D2L (www.achievementstandards.org).
In the ASN, standards are hierarchically structured: first by source; e.g., by state; within source by type; e.g., science or mathematics; within type by subtype, then by grade, etc.
NGSS: Next Generation Science Standards - Science
| NGSS Performance Expectation | ||
|---|---|---|
|
HS-PS1-3. Plan and conduct an investigation to gather evidence to compare the structure of substances at the bulk scale to infer the strength of electrical forces between particles. (Grades 9 - 12) Do you agree with this alignment? |
||
| Click to view other curriculum aligned to this Performance Expectation | ||
| This activity focuses on the following Three Dimensional Learning aspects of NGSS: | ||
| Science & Engineering Practices | Disciplinary Core Ideas | Crosscutting Concepts |
| Plan and conduct an investigation individually and collaboratively to produce data to serve as the basis for evidence, and in the design: decide on types, how much, and accuracy of data needed to produce reliable measurements and consider limitations on the precision of the data (e.g., number of trials, cost, risk, time), and refine the design accordingly. Alignment agreement: | The structure and interactions of matter at the bulk scale are determined by electrical forces within and between atoms. Alignment agreement: | Different patterns may be observed at each of the scales at which a system is studied and can provide evidence for causality in explanations of phenomena. Alignment agreement: |
Common Core State Standards - Math
-
Use volume formulas for cylinders, pyramids, cones, and spheres to solve problems.
(Grades
9 -
12)
More Details
Do you agree with this alignment?
-
Apply geometric methods to solve design problems (e.g., designing an object or structure to satisfy physical constraints or minimize cost; working with typographic grid systems based on ratios).
(Grades
9 -
12)
More Details
Do you agree with this alignment?
International Technology and Engineering Educators Association - Technology
-
Determine the best approach by evaluating the purpose of the design.
(Grades
9 -
12)
More Details
Do you agree with this alignment?
State Standards
Washington - Science
-
Apply scientific principles and evidence to provide an explanation about the effects of changing the temperature or concentration of the reacting particles on the rate at which a reaction occurs.
(Grades
9 -
12)
More Details
Do you agree with this alignment?
-
Matter and Its Interactions
(Grades
9 -
12)
More Details
Do you agree with this alignment?
-
Construct and revise an explanation for the outcome of a simple chemical reaction based on the outermost electron states of atoms, trends in the periodic table, and knowledge of the patterns of chemical properties.
(Grades
9 -
12)
More Details
Do you agree with this alignment?
Materials List
This activity is composed of three parts:
Part 1: Property Investigation
Part 2: Myth Busters' Investigation
Part 3: Become a Design Engineer
The activity is designed to be completed during three 55-minute periods over three days. Some materials can be re-used across the three days, some materials are used on only one or two days, and other materials will be used up (such as test liquids).
Overall Activity Materials
Each group needs:
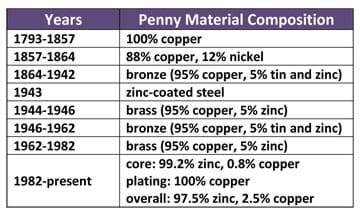
- 4 copper pennies (post-1982, see Table 1; need one penny for each liquid being tested)
-diameter: 0.75 inches (19.05 mm)
-thickness: 0.75 inches (19.05 mm)
-weight: 2.5 g
- 4 plastic "coins" (same size as a standard penny, available at hardware stores as an item put under glass placed on table tops, need one for every liquid being tested)
- 3 liquids (minimum), ~50-60 ml for each group (such as pure distilled water, ethanol, hydrogen peroxide, vegetable oil, salt water mixture, soapy water mixture, any type of soda/pop; different concentrations of salt or soap yield different results; the goal is to have liquids that respond differently when in contact with the penny and coin surfaces; choose liquids that have very different surface tensions; refer to Table 2)
![A table shows surface tension (in dyne/cm) of various liquids: acetone (23.7), ethanol (22.27), ethanol [40% mass + water] (29.63), ethanol [11.1% mass + water] (46.03), isopropanol (21.7), sucrose [55% mass + water] (76.45), and water (72). A table shows surface tension (in dyne/cm) of various liquids: acetone (23.7), ethanol (22.27), ethanol [40% mass + water] (29.63), ethanol [11.1% mass + water] (46.03), isopropanol (21.7), sucrose [55% mass + water] (76.45), and water (72).](/content/wsu_/activities/wsu_penny/table2newweb.jpg)
- 3 x 50-ml glass beakers, one for each liquid being tested
- 3 disposable eye droppers or pipettes, need one for each liquid being tested
- ruler
- calculator
- plastic weighing dish
- graduated cylinder (or graduated pipette)
To share with entire class:
- paper towels
- cotton balls (or paper towels), to clean pennies and coins after testing
- isopropanol, to clean pennies and coins after testing
- de-ionized water, for rinsing
- waste container, for used liquids
- electronic scale, to measure weights of pennies and average liquid drop weights (depending on class size, you may want multiple scales)
- 3 surface treatment suggestions (choose minimum of three):
-hair spray (1 can)
-Pam cooking spray (1 can, composed of canola oil)
-fast-drying spray adhesive (1 can)
-waterproof spray paint (1 can)
-medium- to high-grit sandpaper (1 package)
-aluminum foil (2 rolls, depending on size)
-paraffin wax paper ~ stretchy (1 box)
- hair dryer, or other method of drying wet surface treatments
Part 1 Materials
Each group needs:
- Part 1 Worksheet
- 3 x 50-ml beakers
- graduated cylinder (or graduate pipette)
- calculator
- 32 ml of each liquid
- plastic dish
- 3 plastic pipettes
- 4 copper pennies
- 4 plastic coins

To share with the entire class:
- electronic scale
- de-ionized water
- waste container
- paper towels
- cotton balls (or paper towels), to clean pennies and coins after testing
- isopropanol, to clean pennies and coins after testing
Part 2 Materials
Each group needs:
- Part 2 Worksheet
- Student Testing Page
- 3 x 50-ml beakers
- calculator
- ruler
- 16 ml of each liquid
- 3 plastic pipettes
- 3 copper pennies
- 3 plastic coins
To share with the entire class:
- electronic scale
- waste container
- paper towels
- cotton balls (or paper towels), to clean pennies and coins after testing
- isopropanol, to clean pennies and coins after testing
- de-ionized water, for rinsing
Part 3 Materials:
Each group needs:
- Part 3 Worksheet
- 50-ml beaker
- 2 copper pennies
- 2 plastic coins
- 2 plastic pipettes
- calculator
- ruler
To share with the entire class:
- blank printer paper
- waste container
- surface treatment materials
- test liquids ~10 ml of each per group
- hair dryer, or other method of drying wet surface treatments
- paper towels
- cotton balls (or paper towels), to clean pennies and coins after testing
- Isopropanol, to clean pennies and coins after testing
- de-ionized water, for rinsing
- scissors, for cutting surface treatment materials
Note: In this activity, "penny" refers to the copper penny, and "coin" refers to the coin-shaped plastic disk.
Worksheets and Attachments
Visit [www.teachengineering.org/activities/view/wsu_penny_activity1] to print or download.Pre-Req Knowledge
Students should be familiar with:
- Math concepts: circle area, sphere volume, numerical data graphing and calculating averages
- Science concepts: determining mass of liquids and solids, determining density of liquids, making measurements with ruler, using electronic scale, using pipettes, using graduated cylinders (or graduated pipettes)
However, this activity could be used as a means of introducing many of these concepts.
Introduction/Motivation
Whether we are discussing gases, liquids or solids, understanding how a surface interacts with contacting materials is critical in all engineering disciplines. Engineers must be concerned with selecting the best overall materials to use for the products, structures and systems they design. Additionally, they must be aware of how a solid may be affected through exposure to other materials.
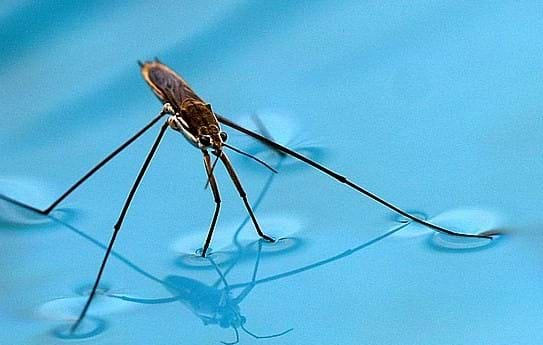
We are familiar with some interactions between solids and liquids in our daily lives because they are easy to observe. Some of them exhibit surface tension effects.
Surface tension is a property of the surface of a liquid that allows it to resist an external force. This property is caused by the cohesion of like molecules, and is responsible for many of the behaviors we see in liquids. Surface tension has dimensions of force per unit length, or of energy per unit area.
For example, surface tension is at work when you observe an object floating on the surface of water, even though the object is denser than water. Surface tension also enables some insects (such as water striders) to run on the water surface. A critical design aspect in the coatings used to make "waterproof" clothing is testing how well the fabric can force water to "bead-up" instead of soak into the fabric. Another example that we have all probably seen is when rain falls on a freshly washed and waxed car; we see the water bead up instead of spreading across the entire surface. This phenomenon speaks to the wetting ability of the surface. When a surface repels water (or causes the water to bead-up as opposed to spreading out) the surface is considered hydrophobic. If water can spread into a thin sheet across the surface it is considered hydrophilic.
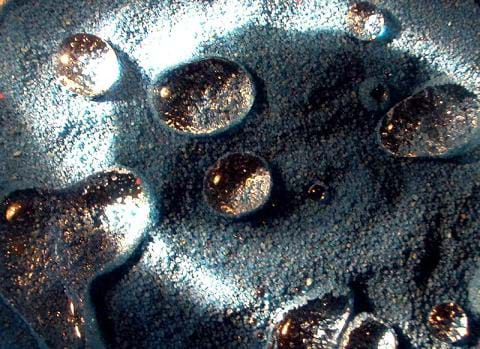
Now imagine yourself as an engineer—can you think of the possibilities and benefits to developing a material (or coating) that is self-cleaning? Self-cleaning surfaces are possible because of the effects of surface tension, but requires the perfect combination of surface and liquid. What might be some of the benefits of self-cleaning surfaces? Examples: Self-cleaning surfaces can improve the efficiency of solar panels by keeping them clean, since a layer of dust can reduce its efficiency by 15%. Self-cleaning surface coatings on the inside of pipes would prevent fouling (either wall build-up or wall corrosion) on the inside of the pipe, eliminating the need to replace old pipes.
Click here to see an interaction between a liquid and solid surface that exhibits super hydrophobic behavior. The water beads up on the wood surface instead of spreading out over it.
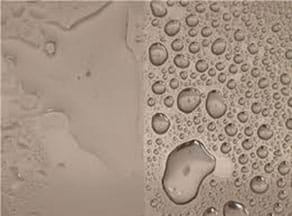
The image below shows what a hydrophilic coating looks like on glass. The left side of the glass slide was treated with a hydrophilic coating that caused the water to form a sheet of liquid, while the right side was untreated, resulting in the water beading up on the surface. By developing surface treatments that result in water forming a sheet, engineers create "self-cleaning" materials.
Procedure
Background
This activity is flexible in the types/number of test liquids and the types of surface treatments that may be provided to students. As necessary, make modifications to the student worksheets by being aware of the following assumptions in the design of each.
Part 1 Considerations:
- Materials listed in the Part 1 Worksheet are specifically for three liquids; change quantities depending on the number of liquids your class will test.
- Provide the opportunity for the class to agree on a standard test method for generating droplets (before they begin testing but after the worksheet has been handed out).
- Equations provided on the worksheet for calculating droplet diameter are based on the volume having units of ml and the droplet diameter having units of mm.
- Students need results from Part 1 to perform calculations in Part 2.
-Have each group use their own numbers.
-Have groups record on the board their values for each liquid (mdrop and density), then use this as an opportunity to perform statistical analysis on the data, as a class. This could be converted into a full class period activity in which students look at a scatter plot of all the data, determine the mean, median, mode, standard deviation, and conclude whether any erroneous data (outliers) exist that should be omitted.
-Provide the class with values for each liquid (mdrop and density) based on the teacher's measurements or class measurements.
Part 2 Considerations:
- Materials listed on the Part 2 Worksheet assume three liquids being tested.
- Figures 1-3 are all based on testing for three liquids.
- Analysis question 1 requires groups to look at the equations used in Part 1 (may need to provide some hints to help the class correctly approach this question.
Part 3 Considerations:
- May need to change the materials list depending on offered choices of liquids and surface treatments.
It is highly recommended that the chosen combination(s) of liquids and surface treatments be tested in advance of having students work with them. This helps to clarify when extra time that may be needed during testing. The solutions are not provided since any variations in the surface or surface treatment application, pipette, and/or liquid being used will generate different results. However, critical answers are supplied in the Background section (above).
Before the Activity
Day 1:
- (optional) Run through Parts1-3 on your own.
- Collect liquids and/or create liquid mixtures.
- Gather remaining materials.
- Make any necessary changes to the worksheets (see Background Section for considerations).
- Make copies of the Part 1 Worksheet, one per group of two students.
- Prepare a data table on the board for students to record their results.
-mass of penny
-mass of coin
-diameter of penny
-diameter of coin

Day 2:
- Label sets of 50-ml glass beakers with the names of the test liquids.
- Pour approximately 20 ml of each fluid into a 50-ml beaker.
- Make copies of the Part 2 Worksheet and Student Testing Page, one each per group of two students
- Prepare a data table on the board for students to record their results.

Day 3:
- Collect materials,
- Make copies of the Part 3 Worksheet, one per group of two students
- Prepare a data table on the board for students to record their results.

With the Students
Day 1: Part 1: Property Investigation
On the first day of this activity, students "investigate" and measure critical properties associated with the activity materials. Specifically, they determine the mass and size of liquid droplets formed with their pipettes, the density of their test liquids, and the mass and dimensions of the copper penny and plastic coin. It is important that students realize that while many of these properties could be looked-up (online, in reference books, etc.), it is always "good practice" for engineers (and scientists) to perform their own measurements to verify that the values are "valid" for their specific materials in hand.
Begin by providing students with an overview of the activity. Include a brief description of what they will be doing each day and how each part contributes to the ultimate engineering design aspect of the activity. For example, by acquiring a general idea of the liquid-surface interactions (in Part 2), they avoid making poor design decisions later (in Part 3). Without knowing accurate liquid and solid properties (from Part 1) the data collected in Part 2 will not have much meaning because the value of number of drops is not a transferable value (for example if different pipettes were used, or if the room temperature or humidity were different).
Next, describe some engineering applications to give a general motivation behind why the behavior they will be observing (interactions on a surface) might be important in the real-world and to engineers. For example, in many cases fouling (or corrosion) on a surface impacts how devices and objects perform. A house pipe might become corroded on the inside and prevent or contaminate the flow of liquids. Dust collecting on a solar panel lowers the amount of electricity that can be generated because the dust limits how much solar energy reaches the electrical capacitors inside the panel. This is similar to how it becomes difficult to see through your car windows if they get really dirty. Another very different example is when liquids are used as a means to transfer heat. Due to conduction, the liquid film creates an extra "insulation," which alters the amount of heat being transferred.
Describe the general engineering design process during Day 1 or discuss it thoroughly on Day 3. The steps of the engineering design process form the basic process that the class follows during this activity:
- Identify the need
- Survey possible solutions
- Make hypothesis(es)
- Test solutions
- Collect data
- Data analysis (assess hypothesis)
- Identify best solution ("best" solution generally considers the following aspects)
-performance
-material selection
-cost of material (for example, when choosing materials for a car, titanium may be a stronger metal than steel, but it would increase the cost of the car, making it too expensive for most people)
-weight of material (for example, race cars and sports cars are generally made primarily with fiberglass instead of steel; in this case, power and speed are the most important design objectives so engineers minimize weight)
-compatibility (for example, is a paper cup [without a waxed lining] the best way to hold water long term? Demonstrate by setting aside a dixie cup and a glass beaker over the course of a day)
-physical properties (for example, engineers must consider the melting point of a metal if equipment made from it is required to hold a very hot gas; some special metals are designed to handle 1000 °C temperatures)
-lifetime (or durability) of material (for example, engineers need to know if what they are designing is intended to be a one-time-use product or to last a long time and be used over and over again; consider the advantages provided to consumers with the development of Nalgene bottles. What were the options before water bottles?)
- Justify and explain final design decision
Next, have students arrange themselves into groups of two and provide each group with one copy of the Part 1 Worksheet. As a class, review what they will be doing in the lab. Introduce the procedures for each test, demonstrating the materials they will be using, as necessary. Then, lead the class in a discussion about the importance of test procedures (to enable a uniform test that results in similar results independent of the person performing the test). In this discussion, have the class agree on procedures for generating droplets (in Part 1, the speed is critical; in Part 2, the speed, height and location are all critical for uniform testing). Have teams write the speed on Page 1 of their worksheets.
Day 2: Part 2: Myth Busters' Investigation
Depending on the number of liquids your class will be testing (and their proficiency at following the test procedures), Part 2 may need to extend into Day 3, especially if allowing more time to discuss results with the entire class (which is HIGHLY recommended).
First, have students move into their groups and hand out copies of the Part 2 Worksheet and Student Testing Sheet. Discuss with the class (again) how each group should approach generating reproducible droplets. Have groups describe these procedures on the Part 2 Worksheet (page 1). Then have groups record the critical values from the previous day onto their Part 2 Worksheet (page 1).
Go through the student-designed test procedures for Part 2 and emphasize that students should only test the heads-side of the copper penny. If you are dividing the class (half testing heads and half testing tails), make these assignments now. Discuss with the class why this would be important (again, reproducibility of results and the two sides are clearly different). When no more questions or clarifications are forthcoming, direct teams to begin testing the fluids.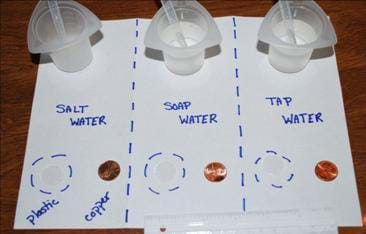


Day 3: Part 3: Become a Design Engineer
Have the same groups form as on the previous days. Today you will add a "twist" to what you did in Part 2. Now groups will have the opportunity to make changes to properties of the surface (surface treatments). Hand out the Part 3 Worksheets (one per group). Then begin a class discussion of the Part 3 goal, which is for students to be imaginative and recognize possible trends in performance based on how the liquids interact with the surface. As desired, extend Part 3 to provide the class with more time to do investigations into how liquids and solids interact.
Be sure to discuss the general engineering design process if it was not discussed during Day 1.
Each group's design challenge is to MAXIMIZE the volume of liquid a surface can hold while also MINIMIZING the cost of materials. They now also have the control of which liquid to use, which surface to use, and what surface treatments (if any) to use. Explain that everything they use has a cost associated with it (this is the way it works for engineers too!). Groups can test multiple designs (caution them on how much time is available though). Students also now have freedom as they collect data. Depending on the level of the class, provide them with examples of "good" data to record. Have students use the Part 3 Worksheet tables to record critical values measured in Parts 1 and 2. Be sure that all groups are using the same values (this ensures that test results from each design are comparable).
At the end of testing, with at least 20 minutes left at the end of the period, have students record on the board the statistics on their best design solution (surface, liquid, modification, # drops, volume and cost). Lead a class discussion of to share and compare final test results. Did any groups test the same design with different results? Which designs had the same cost but different results? Which designs had the same results but different costs? What can we conclude? Which best met the requirements of the design challenge? Which is the optimum design?
Vocabulary/Definitions
area: The two-dimensional size, or total exposed surface, of an object. Example units are square cm and acres.
compatibility: A measure of how stable a material is when mixed or in contact with another material. If two materials do not change when in contact, then they are considered compatible.
durability: Refers to the lifetime of a material or product. A material that has a long usable life is considered durable.
hydrophilic: Hydrophilic molecules tend to be charged or polar molecules, enabling them to more easily dissolve in water.
hydrophobic: Hydrophobic molecules tend to be non-polar and thus repel themselves from polar molecules including water. Water on a hydrophobic surface tends to bead up on the surface, exhibiting a high contact angle. Hydrophobic materials are commonly used for oil removal from water because the hydrophobic material attracts the oils and not the water, thus separating the two.
physical property: Any aspect of an object or substance that can be measured or perceived without changing its identity. Physical properties can be intensive or extensive. An intensive property does not depend on the size or amount of matter in the object, while an extensive property does.
volume: The space that an object or material occupies in three-dimensional space. Example units are milliliters (ml) and cubic cm.
Assessment
Worksheets: Have students use the three worksheets to guide each portion of the activity. Review their data and answers to gauge their comprehension of the material.
Optimum Design Discussion: As a class, compare Part 3 design results for looking for the optimum designs. Which team's design best met the design challenge?
Reflection: At activity end, ask students to reflect back on the three-part activity, writing no more than a page that expresses how they would describe the activity to a younger student, what they learned that they didn't know before, what their group partner was best at contributing to their teamwork, their favorite step of the engineering design process, and what changes to the activity would make it better.
Safety Issues
People should never ingest liquids and chemicals in a lab setting, even if they think they know what they are.
Activity Extensions
Have students investigate whether the ridge on the penny plays a role. This requires purchasing flat copper disks that are identical in size to copper pennies for testing.
Have the class determine whether the head or tail side of penny holds more. If you have a large enough class, have one-half of the class test the heads-side and the other half test the tails-side and compare the results at the end of Part 2.
Have the class investigate the variance in using different drop generation methods.
Subscribe
Get the inside scoop on all things Teach Engineering such as new site features, curriculum updates, video releases, and more by signing up for our newsletter!More Curriculum Like This

Students are presented with the concepts of wetting and contact angle. They are also introduced to the distinction between hydrophobic and hydrophilic surfaces. Students observe how different surfaces are used to maintain visibility under different conditions.

Students learn about the basics of molecules and how they interact with each other. They learn about the idea of polar and non-polar molecules and how they act with other fluids and surfaces. Students acquire a conceptual understanding of surfactant molecules and how they work on a molecular level. ...

Students are introduced to superhydrophobic surfaces and the "lotus effect." Students learn how plants create and use superhydrophobic surfaces in nature and how engineers have created human-made products that mimic the properties of these natural surfaces.

Students observe how water acts differently when placed on hydrophilic and hydrophobic surfaces. They determine which coatings are best to cause surfaces to shed water quickly or reduce the "fogging" caused by condensation.
Copyright
© 2013 by Regents of the University of Colorado; original © 2009 Board of Regents, Washington State UniversityContributors
Courtney Herring (WSU Gene and Linda Voiland School of Chemical Engineering and Bioengineering)Supporting Program
CREAM GK-12 Program, Engineering Education Research Center, College of Engineering and Architecture, Washington State UniversityAcknowledgements
This content was developed by the Culturally Relevant Engineering Application in Mathematics (CREAM) Program in the Engineering Education Research Center, College of Engineering and Architecture at Washington State University under National Science Foundation GK-12 grant no. DGE 0538652. However, these contents do not necessarily represent the policies of the NSF, and you should not assume endorsement by the federal government.
Last modified: February 13, 2020


User Comments & Tips