
A Tornado in My State?
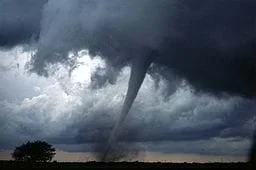 A tornado in Oklahoma.Copyright Wikimedia Commons http://commons.wikimedia.org/wiki/File:Dszpics1.jpg
Students analyze data of tornadoes throughout the United States. They create a bar graph of the number of tornadoes for the top ten states in the country and then calculate the median and the mode of the data.
Engineers of all disciplines organize data into tables and graphs to help them better understand problems and formulate solutions. Engineers use computers to analyze and graph tornado and storm data, which helps them design better warning systems and predict occurrence patterns. Some civil engineers also prototype and test construction methods and materials so new structures are sturdier and safer in a tornado.
After this activity, students should be able to:
- Explain why engineers need to know where tornadoes occur and how engineers might analyze data to determine those patterns.
- Be able to rank states according to the number of tornadoes (greatest to least).
- Explain the difference between and how to calculate the median and the mode.
- Create bar graphs and interpret data of tornado occurrences.
- 6.3.1.d.ii.3 Give quantitative measures of center (median and/or mean) and variability (interquartile range and/or mean absolute deviation), as well as describing any overall pattern and any striking deviations from the overall pattern with reference to the context in which the data were gathered.
Grade 6
Do you agree with this alignment? - 3.3.1.a.i Draw a scaled picture graph and a scaled bar graph to represent a data set with several categories.
Grade 3
Do you agree with this alignment?
- Develop and communicate an evidence-based scientific explanation for changes in weather conditions
Grade 5
Do you agree with this alignment?
- CCSS.Math.Content.3.MD.B.3 Draw a scaled picture graph and a scaled bar graph to represent a data set with several categories. Solve one- and two-step "how many more" and "how many less" problems using information presented in scaled bar graphs.
Grade 3
Do you agree with this alignment? - CCSS.Math.Content.6.SP.B.5 Summarize numerical data sets in relation to their context, such as by:
Grade 6
Do you agree with this alignment? - CCSS.Math.Content.6.SP.B.5a Reporting the number of observations.
Grade 6
Do you agree with this alignment? - CCSS.Math.Content.6.SP.B.5b Describing the nature of the attribute under investigation, including how it was measured and its units of measurement.
Grade 6
Do you agree with this alignment? - CCSS.Math.Content.6.SP.B.5c Giving quantitative measures of center (median and/or mean) and variability (interquartile range and/or mean absolute deviation), as well as describing any overall pattern and any striking deviations from the overall pattern with reference to the context in which the data were gathered.
Grade 6
Do you agree with this alignment? - CCSS.Math.Content.6.SP.B.5d Relating the choice of measures of center and variability to the shape of the data distribution and the context in which the data were gathered.
Grade 6
Do you agree with this alignment?
- STEL-3D Explain how various relationships can exist between technology and engineering and other content areas.
Grades 3-5
Do you agree with this alignment?
- MS-ESS3-2 Analyze and interpret data on natural hazards to forecast future catastrophic events and inform the development of technologies to mitigate their effects.
Grades 6-8
This resource focuses on the following Three Dimensional Learning aspects of NGSS:
Science & Engineering Practices- Construct an oral and written argument supported by empirical evidence and scientific reasoning to support or refute an explanation or a model for a phenomenon or a solution to a problem.Do you agree with this alignment?
Disciplinary Core Ideas- Mapping the history of natural hazards in a region, combined with an understanding of related geologic forces can help forecast the locations and likelihoods of future events.Do you agree with this alignment?
Crosscutting Concepts- The uses of technologies and any limitations on their use are driven by individual or societal needs, desires, and values; by the findings of scientific research; and by differences in such factors as climate, natural resources, and economic conditions. Thus technology use varies from region to region and over time.Do you agree with this alignment?
- Graphs, charts, and images can be used to identify patterns in data.Do you agree with this alignment?
Do you agree with this alignment? - Construct an oral and written argument supported by empirical evidence and scientific reasoning to support or refute an explanation or a model for a phenomenon or a solution to a problem.
Each group should have:
- Ruler
- Graph paper
- Pencils
- Markers, crayons, or colored pencils
- Calculator
- Copy of either the Ranked Worksheet (easier) (PDF) or the Alphabetized Worksheet (advanced) (PDF)
The United States, on average, experiences about 1,000 tornadoes a year. They can range from a few feet to more than a mile in diameter and can travel distances from a few hundred feet to many miles.
In the United States tornadoes occur with the highest intensity and highest frequency in a region called 'Tornado Alley.' This region, which is located east of the Rocky Mountains, covers all or parts of the following states: Alabama, Arkansas, Florida, Georgia, Illinois, Indiana, Iowa, Kansas, Louisiana, Mississippi, Missouri, Nebraska, Oklahoma, South Dakota and Texas. However, tornadoes can occur in each of the 50 states.
Engineers work to build structures that better withstand the strong winds of a tornado, especially in those states where tornadoes occur most frequently. They also collect and analyze data to better understand tornadoes so that they can better predict where they will occur and how damaging they might be.
In this activity, we will look at the number of tornadoes that has occurred in each state during the period 1950-1994. We will analyze some of these data and represent them in various forms.
Before the Activity
- Decide if the students will work with the Ranked Worksheet (PDF) or the Alphabetized Worksheet (PDF) tables. (Note: the ranked data will be easier, whereas the alphabetized data will provide an extra challenge.)
- Copy the tables for each student.
With the Students
- Explain to the students that tornadoes can form in any state and that they will be looking to see which states have the most and least tornadoes.
- Ask students to predict which states they think will have the most and least tornadoes. What about their home state? Alaska? Hawaii? Students should write their prediction in their science journals or on a sheet of paper.
- Have the students get into pairs. Pass out either the Ranked Worksheet (PDF) or the Alphabetized Worksheet (PDF) to students.
- Have students create a bar graph of the ten states with the most tornadoes.
- Have students create a bar graph of the ten states with the least tornadoes.
- Which state actually has the most? (Answer: Texas) Which state has the least? (Answer: Alaska) Where there any surprises? Have students write the answer on their worksheets.
- Explain to students that the median is the middle value of a series of numbers, and mode is the number that occurs the most often.
- Have students find the median and the mode of the data set and record their values on their worksheets. Providing students with a ranked data set will be very helpful for this part. (The median will be between the 25th and 26th, ranked states, Wyoming and South Carolina respectively. The exact answer would be 428.5, but anything between 423 and 434 could be acceptable.) The mode is 886.
- Have the students look at their original predictions (what states they think will have the most and least tornadoes). Was their prediction right? How close were their predicted states to the median and mode of the data?
- Using engineering terms, have students write a summary of the data they graphed. Tell them to write a paragraph summarizing what the graphs tell them. This should be 3-4 sentences describing any patterns they see, the median and mode of the data, and why understanding the data is important to engineers.
Pre-Activity Assessment
Prediction: Have students predict which states have the most and fewest tornadoes. Have them write their answers down in their science journals or on a sheet of paper.
Activity Embedded Assessment
Worksheet/ Pairs Check: Have students work individually or in pairs on their worksheet. Students who work in pairs should check each other's answers.
Post Activity Assessment
Prediction Revisited: Have students review which states have the most and fewest tornadoes. Have them look at their predictions in their science journals or on a sheet of paper. Were they right?
Graphing: Students should create a bar graph of the ten states with the most number of tornadoes. Students then create a bar graph of the ten states with the least number of tornadoes.
Engineering Analysis: Have students write an engineering analysis of the data they graphed. Tell them to write a paragraph summarizing what the graphs tell them. This should be 3-4 sentences describing any patterns they see, the median and mode of the data, and why understanding the data is important to engineers.
Make sure students clearly understand what median and mode are.
Calculators will probably be necessary to calculate the mean of the data.
For more math extensions, have students use the Alphabetized Worksheet (PDF) and put all 50 states in ranked order.
Have students research tornado activity in their own state.
The following website has state-specific information about tornadoes, including annual averages of tornadoes and averages of very strong tornadoes by state https://www.ncdc.noaa.gov/climate-information/extreme-events/us-tornado-climatology.
For advanced students: Calculate the average number of tornadoes in the top ten states for a given year (students should find the average of the top ten states and than divide that number by 45 because data is for 45 years).
http://www.tornadoproject.com/
http://www.noaa.gov/tornadoes.html
http://www.asce.org/pressroom/publicpolicy/ka0100_windhazard.cfm
http://www.nssl.noaa.gov/
http://www.noaa.gov/tornadoes.html
http://www.chaseday.com/tornadoes.htm
http://www.spc.noaa.gov/archive/tornadoes/st-trank.html
- Natural Disasters: Earthquakes, Volcanoes, Tornadoes & More
Contributors
Jessica Todd; Melissa Straten; Malinda Schaefer Zarske; Janet Yowell
Supporting Program
Integrated Teaching and Learning Program, College of Engineering, University of Colorado Boulder
Acknowledgements
The contents of this digital library curriculum were developed under a grant from the Fund for the Improvement of Postsecondary Education (FIPSE), U.S. Department of Education, and National Science Foundation GK-12 grant no 0338326. However, these contents do not necessarily represent the policies of the Department of Education or National Science Foundation, and you should not assume endorsement by the federal government.
Copyright
2004 by Regents of the University of Colorado.