Quick Look
Grade Level: 5 (4-6)
Time Required: 45 minutes
Plus data collection 5 minutes a day for two weeks.
Expendable Cost/Group: US $2.50
Group Size: 4
Activity Dependency: None
NGSS Performance Expectations:

| MS-ESS2-5 |

Summary
Students build and observe a simple aneroid barometer to learn about changes in barometric pressure and weather forecasting.Engineering Connection
Often, pollutants that damage the environment and affect public health are carried by the wind hundreds of miles from their origins. Engineers must understand barometric air pressure and analyze wind patterns to track the source of air pollution, and predict the future path and expected dispersion of traveling air pollution. Engineers use this information to monitor and reduce pollution levels and determine new pollution prevention programs.
Learning Objectives
After this activity, students should be able to:
- Understand and explain how a barometer works.
- Build a model aneroid barometer and use it to indicate when atmospheric pressure is rising or falling.
- Graph the changes in barometric pressure during a two-week period.
Educational Standards
Each TeachEngineering lesson or activity is correlated to one or more K-12 science,
technology, engineering or math (STEM) educational standards.
All 100,000+ K-12 STEM standards covered in TeachEngineering are collected, maintained and packaged by the Achievement Standards Network (ASN),
a project of D2L (www.achievementstandards.org).
In the ASN, standards are hierarchically structured: first by source; e.g., by state; within source by type; e.g., science or mathematics;
within type by subtype, then by grade, etc.
Each TeachEngineering lesson or activity is correlated to one or more K-12 science, technology, engineering or math (STEM) educational standards.
All 100,000+ K-12 STEM standards covered in TeachEngineering are collected, maintained and packaged by the Achievement Standards Network (ASN), a project of D2L (www.achievementstandards.org).
In the ASN, standards are hierarchically structured: first by source; e.g., by state; within source by type; e.g., science or mathematics; within type by subtype, then by grade, etc.
NGSS: Next Generation Science Standards - Science
| NGSS Performance Expectation | ||
|---|---|---|
|
MS-ESS2-5. Collect data to provide evidence for how the motions and complex interactions of air masses results in changes in weather conditions. (Grades 6 - 8) Do you agree with this alignment? |
||
| Click to view other curriculum aligned to this Performance Expectation | ||
| This activity focuses on the following Three Dimensional Learning aspects of NGSS: | ||
| Science & Engineering Practices | Disciplinary Core Ideas | Crosscutting Concepts |
| Collect data to produce data to serve as the basis for evidence to answer scientific questions or test design solutions under a range of conditions. Alignment agreement: | The complex patterns of the changes and the movement of water in the atmosphere, determined by winds, landforms, and ocean temperatures and currents, are major determinants of local weather patterns. Alignment agreement: Because these patterns are so complex, weather can only be predicted probabilistically.Alignment agreement: | Cause and effect relationships may be used to predict phenomena in natural or designed systems. Alignment agreement: |
Common Core State Standards - Math
-
Draw a scaled picture graph and a scaled bar graph to represent a data set with several categories. Solve one- and two-step "how many more" and "how many less" problems using information presented in scaled bar graphs.
(Grade
3)
More Details
Do you agree with this alignment?
International Technology and Engineering Educators Association - Technology
-
Explain how various relationships can exist between technology and engineering and other content areas.
(Grades
3 -
5)
More Details
Do you agree with this alignment?
State Standards
Colorado - Math
-
Display numerical data in plots on a number line, including dot plots, histograms, and box plots.
(Grade
6)
More Details
Do you agree with this alignment?
Colorado - Science
-
Describe weather conditions based on data collected using a variety of weather tools
(Grade
5)
More Details
Do you agree with this alignment?
-
Use data collection tools and measuring devices to gather, organize, and analyze data such as temperature, air pressure, wind, and humidity in relation to daily weather conditions
(Grade
5)
More Details
Do you agree with this alignment?
Materials List
Each group needs:
- 1 empty, wide-mouth jar
- 1 sheet of Mylar or a helium-quality balloon (the same material used for aluminized party balloons; Mylar is relatively impermeable to gas)
- 1 heavy, thick rubber band
- 1 small ball of poster putty (or chewing gum or other adhesive)
- 1 toothpick (or 6-inch piece of dry spaghetti noodle or broom straw)
- 1 piece of cardboard, ~8 x 10 inches, for the barometer scale
- The day's barometric pressure, from newspaper weather page, television or radio weather broadcast, or weather website
- Barometric Pressure Log, one per student
- (optional) graph paper (only needed if students are graphing data), one sheet per student
Worksheets and Attachments
Visit [www.teachengineering.org/activities/view/cub_air_lesson04_activity2] to print or download.Introduction/Motivation
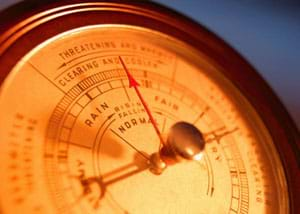
Weather forecasters make predictions on the basis of meteorological data such as wind speed, barometric pressure, relative humidity and temperature. Meteorologists know that one of the most valuable pieces of information in making predictions is atmospheric (barometric) pressure. In fact, the accuracy of a weather forecast based solely on pressure trends is about 70-75%. In this activity, students build an aneroid barometer. Although it is not as accurate as a water barometer, it is more convenient to make and use.
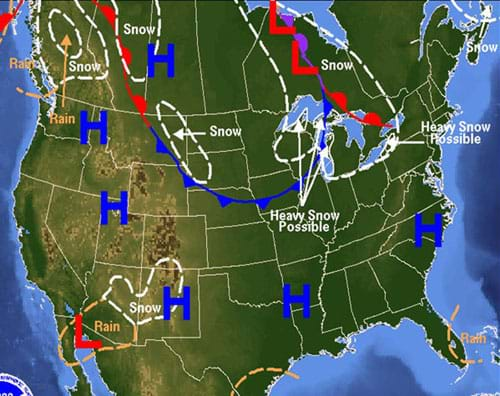
Meteorologists often use maps of air pressure to predict weather patterns. The maps generally have isobars (lines [contours] of equivalent air pressure, as seen in Figure 1). You may have seen maps like this on television or in the newspaper.

High-pressure zones are usually accompanied by fair weather, while low-pressure zones are often associated with stormy weather. Pressure and temperature differentials cause winds. Air moves from regions of high pressure to regions of low pressure. For example, on-shore breezes occur on summer afternoons at the beach when warm air on the land rises and leaves a partial vacuum that is filled by cooler air off the water. Engineers study wind patterns to determine the source of air pollution. Often, pollutants that damage the environment and affect public health are carried by the wind hundreds of miles from their origins.
The most common method of measuring altitude uses the altimeter, which is a barometer that measures atmospheric pressure. As one goes up in altitude, the air pressure decreases.
You may remember from the Air Pressure Experiments: I Can't Take the Pressure! activity that pressure is measured in various units. The units reported in the newspaper or on television are usually in inches of mercury. Sometimes atmospheric pressure is given in millibars (a metric equivalent). Below are some of the common units used to measure pressure and their equivalents at sea level:
- 30.32 in Hg (inches of mercury)
- 1,013 millibars
- 1.013 x 10⁵ Pa (Pascal or N/m2)
- 1 atm (atmosphere)
- 760 mm Hg (millimeters of mercury)
- 14.7 lb/in2 (psi, pounds force per square inch; if 1-pound weight rests on 1-square inch of surface area, the pressure is 1 psi)
Procedure
Before the Activity
- Gather materials and make copies of the Barometric Pressure Log.
- Find a source for the daily barometric pressure such as the weather page from a local newspaper, a television/radio weather report, a local newspaper or TV news website or other website like weather.com.
With the Students
- Ask the students: What is a barometer? Have them brainstorm some ideas and write them on the board. Tell them they will learn more about barometers in today's activity.
- Divide the class into groups of four students each.
- Distribute the supplies to each group: 1 wide-mouth jar, 1 piece of Mylar, 1 rubber band, a small ball of poster putty, 1 toothpick, 1 piece of cardboard.
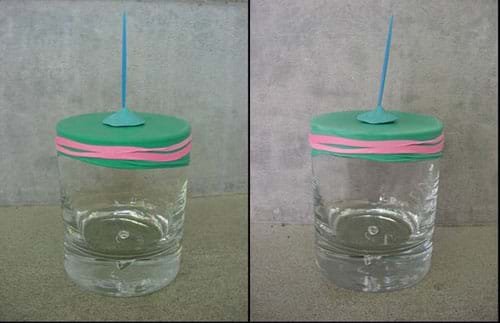
- Seal the jar with the Mylar by stretching the sheet until it forms a tight drum over the top. Use a rubber band to hold it in place. See Figure 2.
- Place a small piece of poster putty in the center of the membrane and place the toothpick in the putty, so that it is standing up, vertically. See Figure 2.
- As the atmospheric pressure decreases, the pressure inside the jar exceeds the external pressure and forces the membrane to bulge up and the toothpick to move down. Conversely, if the atmospheric pressure increases, the membrane bends inward and the needle (toothpick) swings up (see Figure 2).

- Place the barometer near a wall and attach the cardboard to the wall behind it. To calibrate the barometer, write today's barometric pressure reading on the piece of cardboard at the spot where the needle is pointing. Repeat this procedure on days when the pressure is significantly different. Although your barometer may not be very accurate, you should be able to observe major changes in barometric pressure.
- Barometers keep track of air pressure. When air pressure is high (indicating fair weather), the toothpick points up because air is pressing down on the Mylar. When air pressure is low (indicating the bad weather is coming), the toothpick points down because air inside the jar is pushing up against the balloon.
- Pass out the Barometric Pressure Logs. Have students observe their barometers for 1-2 weeks, recording the direction the needle is pointing on their barometer and the actual barometric pressure for that day.
- On the logs, have students make predictions about the weather, reminding them that the accuracy of a weather forecast based solely on pressure trends is about 70-75%. Also, their forecast is valid for 12-24 hours into the future so they can make predictions for the next day.
- Have students record the actual weather conditions, too.
- At the end of the observation period, review the data to determine if there is a relationship between changes in barometric pressure, changes in the weather and being able to predict the weather. Review with students the summary questions on the Barometric Pressure Log. Ask the students: What is a barometer? (Answer: A device for measuring atmospheric pressure.)
- (optional) Have students make a graph of barometric pressure (on the y-axis) vs. time, in days (on the x-axis).
Assessment
Pre-Activity Assessment
Brainstorming: As a class, have the students engage in open discussion. Remind students that in brainstorming, no idea or suggestion is "silly." All ideas should be respectfully heard. Encourage wild ideas and discourage criticism of ideas. Have them raise their hands to respond. Write answers on the board. Ask the students:
- What is a barometer? (After the brainstorming session, tell them they will learn more about barometers in today's activity.)
Activity Embedded Assessment
Worksheet: Use the Barometric Pressure Log to help students follow along with the activity's 1-2 week data collection.
Post-Activity Assessment
Worksheet: After two weeks of observation, review the Barometric Pressure Logs and ask students:
- Did your barometer predict any weather changes? Were the predictions correct?
- Did it predict anything else?
- Do you see any trends? Describe what you see.
Weatherman Explains: Ask students to write a paragraph to a local engineering company about their barometer and what it represents. Also, have the students explain to the engineering company why the engineers may need to know this information.
Safety Issues
Make sure to place the barometers in a place in which they will not be knocked over or broken.
Troubleshooting Tips
This activity is especially suitable during the wet season because changes in pressure are more notable during the course of the day.
Try not to begin this activity on a day with an unusually high or low pressure, which could upset the barometer calibration.
When graphing the data, treat the days as Day 1, Day 2 through Day 14. If there are no data points for the weekend days, have students make predictions for the missing data, based on the graph.
Activity Extensions
To build a water barometer, see pg. 62 in 175 Science Experiments to Amuse and Amaze Your Friends, by Brenda Walpole.
Invite a meteorologist into your classroom to speak about weather prediction.
Some newspapers list the barometric pressure at different times throughout the day. Have the students graph the pressure information over the course of a day. Plot other days on the same graph in different colors.
Activity Scaling
- For younger students, build the barometer as a class, and take turns reading it.
- For older students, in addition to building barometers and making weather predictions that they verify with actual measurements in later classes, incorporate a newspaper activity. Bring to class the weather pages from different newspapers. Before starting the activity, have each team read through their weather page and write a paragraph describing the nation's air pressure for their day, and how they would use that information to forecast the coming weather. Have each team complete their paragraphs before they receive their materials for the rest of the activity.
Subscribe
Get the inside scoop on all things Teach Engineering such as new site features, curriculum updates, video releases, and more by signing up for our newsletter!More Curriculum Like This

Students are introduced to some essential meteorology concepts so they more fully understand the impact of meteorological activity on air pollution control and prevention. They build a simple aneroid barometer to understand how air pressure information is related to weather prediction.

Students gain an understanding of air pressure by using candy or cookie wafers to model how it changes with altitude, comparing its magnitude to gravitational force per unit area, and observing its magnitude with an aluminum can crushing experiment. Worksheets provided.

Students are introduced to air masses, with an emphasis on the differences between and characteristics of high- versus low-pressure air systems. Students explore actual data by comparing maps of high- and low-pressure air masses to radar data showing where weather is occurring

Students are introduced to the basics of the Earth's weather. Concepts include fundamental causes of common weather phenomena such as temperature changes, wind, clouds, rain and snow. The different factors that affect the weather and the instruments that measure weather data are also addressed.
References
Cunningham, J. and Herr, N. Hands-On Physics Activities with Real-Life Applications. West Nyack, NY: The Center for Applied Research in Education, pg. 199, 1994.
Walpole, Brenda. 175 Science Experiments to Amuse and Amaze Your Friends. Random House, pg. 62, 1988.
Copyright
© 2004 by Regents of the University of ColoradoContributors
Amy Kolenbrander; Daria Kotys-Schwartz; Janet Yowell; Natalie Mach; Malinda Schaefer Zarske; Denise W. CarlsonSupporting Program
Integrated Teaching and Learning Program, College of Engineering, University of Colorado BoulderAcknowledgements
The contents of this digital library curriculum were developed under grants from the Fund for the Improvement of Postsecondary Education (FIPSE), U.S. Department of Education and National Science Foundation (GK-12 grant no. 0338326). However, these contents do not necessarily represent the policies of the Department of Education or National Science Foundation, and you should not assume endorsement by the federal government.
Last modified: December 11, 2020


User Comments & Tips