Quick Look
Grade Level: 5 (4-6)
Time Required: 1 hour
Expendable Cost/Group: US $1.00
Group Size: 4
Activity Dependency: None
Associated Informal Learning Activity: I Can't Take the Pressure!
Subject Areas: Algebra
NGSS Performance Expectations:

| 3-5-ETS1-3 |
Summary
Students gain an understanding of air pressure by using candy or cookie wafers to model how it changes with altitude, by comparing its magnitude to gravitational force per unit area, and by observing its magnitude with an aluminum can crushing experiment. Three student worksheets (and answer keys) are provided.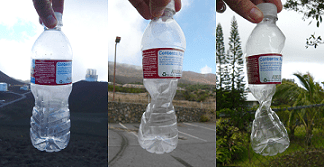
Engineering Connection
Air pressure is a concept that is important for engineers from all fields to understand. For instance, environmental engineers must understand air pressure because it affects the way in which air pollution travels through the air. Especially in highly populated areas, engineers work with local communities to understand their unique weather and atmospheric conditions, and suggest public and industry behavior and policy changes to keep the air quality at a safe level for breathing. They also create new prevention technologies that address air pollution at the sources.
Learning Objectives
After this activity, students should be able to:
- Compare atmospheric pressure (in psi) to the pressure exerted by an object (weight per unit area, in psi).
- Explain why air pressure changes with altitude.
- Identify the locations of high and low pressure in an experiment.
- Describe how engineers must understand air pressure because it affects the way in which air pollution travels via air.
- Identify aspects of pressure that are important to consider in engineering aircraft designs.
Educational Standards
Each TeachEngineering lesson or activity is correlated to one or more K-12 science,
technology, engineering or math (STEM) educational standards.
All 100,000+ K-12 STEM standards covered in TeachEngineering are collected, maintained and packaged by the Achievement Standards Network (ASN),
a project of D2L (www.achievementstandards.org).
In the ASN, standards are hierarchically structured: first by source; e.g., by state; within source by type; e.g., science or mathematics;
within type by subtype, then by grade, etc.
Each TeachEngineering lesson or activity is correlated to one or more K-12 science, technology, engineering or math (STEM) educational standards.
All 100,000+ K-12 STEM standards covered in TeachEngineering are collected, maintained and packaged by the Achievement Standards Network (ASN), a project of D2L (www.achievementstandards.org).
In the ASN, standards are hierarchically structured: first by source; e.g., by state; within source by type; e.g., science or mathematics; within type by subtype, then by grade, etc.
NGSS: Next Generation Science Standards - Science
| NGSS Performance Expectation | ||
|---|---|---|
|
3-5-ETS1-3. Plan and carry out fair tests in which variables are controlled and failure points are considered to identify aspects of a model or prototype that can be improved. (Grades 3 - 5) Do you agree with this alignment? |
||
| Click to view other curriculum aligned to this Performance Expectation | ||
| This activity focuses on the following Three Dimensional Learning aspects of NGSS: | ||
| Science & Engineering Practices | Disciplinary Core Ideas | Crosscutting Concepts |
| Plan and conduct an investigation collaboratively to produce data to serve as the basis for evidence, using fair tests in which variables are controlled and the number of trials considered. Alignment agreement: | Tests are often designed to identify failure points or difficulties, which suggest the elements of the design that need to be improved. Alignment agreement: Different solutions need to be tested in order to determine which of them best solves the problem, given the criteria and the constraints.Alignment agreement: | |
Common Core State Standards - Math
-
Apply the area and perimeter formulas for rectangles in real world and mathematical problems.
(Grade
4)
More Details
Do you agree with this alignment?
-
Add, subtract, multiply, and divide decimals to hundredths, using concrete models or drawings and strategies based on place value, properties of operations, and/or the relationship between addition and subtraction; relate the strategy to a written method and explain the reasoning used.
(Grade
5)
More Details
Do you agree with this alignment?
-
Represent real world and mathematical problems by graphing points in the first quadrant of the coordinate plane, and interpret coordinate values of points in the context of the situation.
(Grade
5)
More Details
Do you agree with this alignment?
International Technology and Engineering Educators Association - Technology
-
Explain how various relationships can exist between technology and engineering and other content areas.
(Grades
3 -
5)
More Details
Do you agree with this alignment?
State Standards
Colorado - Math
-
Represent real world and mathematical problems by graphing points in the first quadrant of the coordinate plane, and interpret coordinate values of points in the context of the situation.
(Grade
5)
More Details
Do you agree with this alignment?
-
Apply properties of operations to calculate with numbers in any form, convert between forms as appropriate, and assess the reasonableness of answers using mental computation and estimation strategies.
(Grade
7)
More Details
Do you agree with this alignment?
Colorado - Science
-
Develop and communicate an evidence-based scientific explanation for changes in weather conditions
(Grade
5)
More Details
Do you agree with this alignment?
-
Use data collection tools and measuring devices to gather, organize, and analyze data such as temperature, air pressure, wind, and humidity in relation to daily weather conditions
(Grade
5)
More Details
Do you agree with this alignment?
Materials List
Student Activity 1: The Strength of Air Pressure
- activity worksheets (3) and reference sheet, 1 set per student; How Great Is Atmospheric Pressure? - Worksheet 1, Amount of Air Pressure on a Square Table and Graph - Worksheet 2, Air Pressure Chart - Worksheet 3, Air Pressure vs. Altitude Data and Graph Reference Sheet
- graph paper, 1-square-inch grid; 1 sheet per student; online source of printable graph paper: http://www.teachervision.com/lesson-plans/lesson-6169.html
- index cards, 1 per student
- sets of 4 objects that will be weighed, such as a textbook, novel, magazine and dictionary; 1 set per group (have one group weigh themselves as the objects)
- tape, to share with the class
- balance (triple beam, small digital, bathroom scale, etc.), to share with the class
Student Activity 2: Air Pressure and Altitude
- Necco or Vanilla Wafers, or colored tiles/blocks, 14 per student
- paper, pencil, ruler; for each student
- (optional) 1 gallon of water, to show students what 8.5 lbs. of weight feels like
Demo 1: Aluminum Can Crush
- 1 aluminum soda can
- 1 large beaker or bucket
- 1 hot plate
- 1 pair of tongs
- 1 cup tap water
- bucket of ice water
- (optional) trivet, to prevent damage to counter top from heated can
Worksheets and Attachments
Visit [www.teachengineering.org/activities/view/cub_air_lesson04_activity1] to print or download.Introduction/Motivation
Pressure is defined as the amount of force applied per unit area or as the ratio of force to area (P = F/A). The pressure an object exerts can be calculated if its weight (the force of gravity on an object) and the contact surface area are known. For a given force (or weight), the pressure it applies increases as the contact area decreases.
To better understand this, have students hold a large book flat on their outstretched hands and notice how much pressure the book puts on it. Then, have them try to balance the book on the tip of their index fingers. How much pressure does it seem to exert now?
It is also important to note that air pressure decreases with increasing altitude (see Figure 1 and Table 1). Table 1 lists the air pressure for specific elevations. See the Air Pressure vs. Altitude Data and Graph Reference Sheet for more detailed comparison.
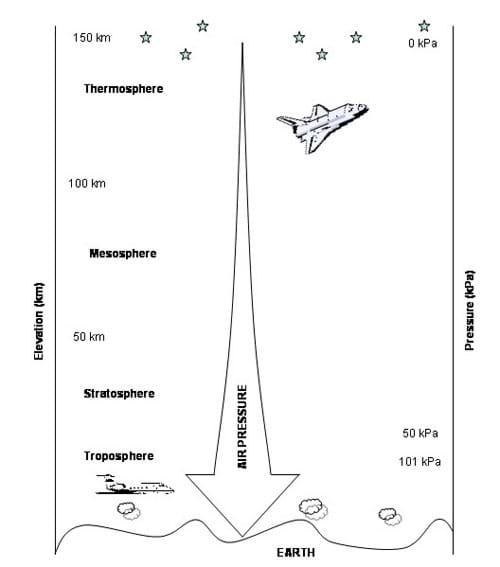

Pressure is measured in various units. Scientists and engineers typically use the metric unit Pascal (Pa). A Pascal is defined as the pressure exerted by a 1 Newton weight (1 kg under Earth's force of gravity) resting on an area of 1 square meter. Below is a list of some of the common units used to measure pressure, and their equivalents. Please note that there are many other units that may be used.
At sea level, the atmospheric air pressure can be represented as any of the following:
- 1.013 x 10⁵ Pa (Pascal or N/m2)
- 1 atm (atmosphere)
- 760 mm Hg (millimeters of mercury)
- 14.7 lb/in2 (psi, pounds force per square inch; if 1-pound weight rests on 1-square inch of surface area, the pressure is 1 psi)
Humans are relatively permeable to air (it can move easily in and out of our bodies) and that is why our internal pressure stays the same as the pressure of the surrounding (ambient) air. This is the same reason why fish are not crushed in the depths of the ocean; they are permeable to water. Although the atmosphere exerts a significant amount of pressure on everything in our environment, the only time most people are aware of air pressure is when it changes (such as changes in altitude, for example, as you drive up a mountain).
As you climb in elevation, the atmospheric pressure decreases while the pressure in your middle ear may remain constant, causing a difference in pressure. This pressure difference causes your eardrums to bulge and possibly produce pain. Yawning relieves the pain because the action opens the small Eustachian tubes between your ear and pharynx allowing air to escape from your middle ear into the atmosphere though your nose and mouth. As the pressure is equalized, your ear "pops" when the eardrum snaps back into its normal position.
Engineers who design airplanes study air pressure. Airplane cabins are "pressurized." This means the inside of the plane maintains a constant pressure of about 14 pounds per square inch regardless of the pressure outside of the cabin. At high altitudes, the air has a very low pressure, which affects the way we breathe. This same effect occurs when people move from sea level locations, such as New York City, to the mountains, such as Denver, CO. Often, it takes a few weeks for their bodies to adjust to the lower pressure.
Procedure
Before the Activity
- Gather materials and make copies of the reference sheet and three worksheets (1, 2, 3).
- If balances and scales are not available in your classroom, determine the mass of the objects before class and provide students with the information.
- Practice the aluminum can demonstration.
Student Activity 1: The Strength of Air Pressure
- Ask students to define air pressure. If necessary, remind them the properties of air: it has mass, it takes up space, it can move, it exerts pressure (it pushes on things) and it can do work.
- Ask: How strong is atmospheric air pressure? (Is it as much pressure as an ant standing on 1 square inch would exert? Or, an elephant? Or, 12 elephants?)
- Tell students they are going to compare the pressure that different objects exert on the Earth (due to gravity) to atmospheric air pressure.
- Divide the class into groups of four students each.
- Distribute to each group the worksheets, graph paper, index cards and four objects (for one group, the four objects could be themselves).
- Have the students determine the mass of their objects and record it on the worksheet 1 (see Figure 2). Direct the group that is weighing themselves to each stand on one flat foot on the scale while the measurement is made.
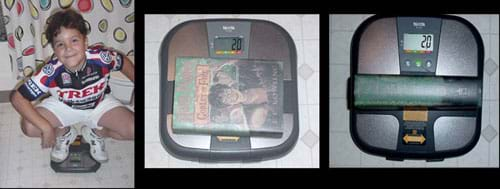
- Direct students to place their object on the grid paper in the same orientation as it was when it was on the balance (the position does not affect the mass, but it affects the contact/surface area value and thus, the ultimate pressure). Have students carefully trace around the object, add up the squares and record the contact area on their worksheets. Have the group that is weighing themselves trace around the foot they stood on. Students may need some help estimating and rounding for partial squares.
- Have students record on their worksheets the data for every group member.
- Ask students to calculate the pressure that each of the objects exerts. (P = F/A, in this case F = weight of the object.)
- Have students write the name of their objects and the resulting pressures on index cards and tape them to the classroom board.
- Have students rearrange the cards in order of increasing pressure.
- On their worksheets, have students predict which object they think has the closest value to the air pressure around them and explain why. Ask a few students to share their predictions.
- Share the actual value of the air pressure with the students (about 14.7 psi at sea level). Were they surprised with the results?
Student Activity 2: Air Pressure and Altitude
- Ask the class: Does air pressure change with altitude? If so, how does it change? Why do they think this happens?
- Direct students to each build a tower using wafers or colored tiles/blocks that is 14-wafers tall (see Figure 3).
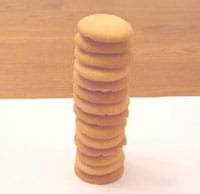
- Ask students: How does this model represent air pressure changing with altitude? (Listen to student explanations.) Explanation: Imagine that the wafers are the air in the atmosphere and that the bottom wafer is at sea level—the lowest point in the troposphere. The top wafer is a higher layer in the stratosphere or some place like the top of Mount Kilimanjaro. Imagine that you are standing at sea level, the level of the bottom wafer. The air pressure at sea level is the highest, because at that point all the air (wafers) is pressing on everything. Now imagine that you are standing on/near the top of the stack, at a higher altitude. Here, much less air (fewer wafers) are pressing on each other, thus the air pressure is less than at sea level.
- Share the sea level air pressure with students (14.7 psi) and the air pressure in your city (for example, Denver, CO, at one-mile high, is about 12.4 psi).
- Ask students to describe in their own words how air pressure changes with altitude, recording their information on worksheet 1.
- Variation: Stack books or pillows in students' laps/arms so they can "feel" the different pressures instead of just visualizing with the wafers.
- Eat the candy or cookie wafers.
- In Denver, the Earth's atmosphere has a force of about 12 pounds per square inch (psi). For reference, a gallon of milk or water weighs about 8 pounds. Show the students what a 1 inch by 1 inch square looks like. Now show the students what a 2 x 2-inch square looks like, and ask them how many pounds would be pressing down on that square. (Answer: 48) See the Amount of Air Pressure on a Square - Worksheet 2, for a comparison of pressures at the altitudes of Boston, MA, and Denver, CO.
- Ask: How many pounds would be pressing on a 3 x 3-inch square? (Answer: 108) A 4 x 4-inch? (Answer: 192) Direct the students to complete the Air Pressure Chart - Worksheet 3.
- Ask: Do you see a pattern? What happens every time the square increases by one in2? (Answer: The pounds of force increases by 12.)
- The average pressure on a middle school student is 24,000 pounds! Ask: Do you feel that pressure? Why don't you feel that pressure? (See if students can explain. Answer: Humans are permeable to air. Air exists inside the body, too—from breathing, through the skin, ears, etc.—and that air balances out the pressure on the outside of the body.)
Demo 1: Aluminum Can Crush
- Fill the bucket with ice water.
- Fill the soda can with approximately 1 cm of water.
- Place the soda can on the hot plate until the water boils. Be alert to not let the can boil dry!
- Use the tongs to carefully remove the can from the heat and place it in an upright position on the tabletop (or trivet).
- Ask: Do you see any change in the can? (See Figure 4.) Direct students to record their observations on worksheet 1
- Repeat the heating process. This time, when you remove the can with the tongs, quickly invert it and submerge the can opening in the bucket of ice water.
- Ask: Do you see any change in the can? (See Figure 4.) Direct students to record their observations on worksheet 1.
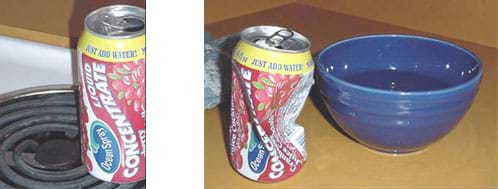
- Direct students to draw a diagram of the experimental results. Have them indicate where the pressure must be the highest with a letter H and the lowest with a letter L. (Answer: Air pressure is lowest, L, inside the overturned can and highest, H, outside the can and around the experiment.)
- Ask: Why do you think the can was crushed? (Listen to some student explanations. Answer: Before heating, the pressure inside and outside the can is the same. We assume the pressures on both sides remain approximately the same while heating since the can does not deform. As the water boils, the air that escapes from the can is gradually replaced by water vapor until the internal atmosphere is composed almost completely of water vapor. When the can is removed from the heat, the vapor pressure drops dramatically. It decreases from 101.3 kPa at 100 ºC to about 2.3 kPa at room temperature. Therefore, as the temperature drops to room temperature, the pressure inside the can drops 97%. If the can is open to the atmosphere, air flows back into the can as the water condenses and keeps the pressure essentially constant. However, if the opening of the can is submerged, the vapor in the can cannot equilibrate with the atmosphere. In the bucket of water, the temperature in the can decreases and the water vapor condenses, creating a pressure difference of almost 99 kPa. Water is forced in to fill this partial vacuum, but before it does, air pressure on the walls implodes the can. Note that the collapsed can contains water (more than when you started), indicating water entered at the same time the walls collapsed.
- Have students work in pairs to answer the following questions:
- The air inside an aircraft is kept at a pressure similar to what human bodies experience at the Earth's surface. Knowing this, what can you say about the pressure difference between the air inside a plane versus the air outside a plane, once a plane is 30,000 ft above the Earth's surface? (Answer: The air pressure is much lower outside the plane than inside the plane.)
- Is pressure pushing from the inside of the plane outwards? Or, is pressure pushing on the outside on the plane inwards? It may help to figure this out by sketching a plane and using arrows to indicate the direction of pressure. (Answer: Pressure is pushing from the inside [high pressure] to the outside where the pressure is lower.)
- How might engineers incorporate this knowledge into their airplane designs? (Answer: Engineers design airplanes, jets, rockets and space shuttles to be strong enough so they do not explode when high in the atmosphere and in conditions in which the inside and outside air pressures are different. The material needs to be much stronger than an aluminum can!)
Assessment
Pre-Activity Assessment
Discussion Questions: Solicit, summarize and integrate student responses to the following questions. After the discussion, explain that these questions will be answered during the upcoming demonstrations and activities. Ask the students:
- What is air pressure?
- How strong is atmospheric air pressure? Is it as much pressure as an ant standing on 1 square inch would exert? Or, an elephant? Or, 12 elephants?
Activity Embedded Assessment
Activity Sheets: Use the three worksheets and reference sheet to help students follow along with the activity. Review their answers to gauge their depth of comprehension.
Post-Activity Assessment
Student-Generated Questions: Ask each student to come up with one question to ask the class, based on the content of the activity. The students may require help in generating the questions. Call on a few students to ask their questions.
Safety Issues
- Make sure that students understand that they could get burned if they touch the hot plate or hot can.
- Make sure the hot plate is turned off when not in use.
Troubleshooting Tips
In English, we use the term "weight" when we really mean mass. Mass is the amount of matter in an object. Weight is the force of gravity on a particular mass. Students may need some clarification. To add to the confusion, we also use the unit of pounds for both! However, mass is measured in pounds-mass and weight in pounds-force.
During the calculation of contact area, students may need some help estimating and rounding for partial squares. It may help to do a quick example on the classroom board or overhead projector.
You may want to start the water boiling in the aluminum can while conducting Student Activity 2: Air Pressure and Altitude—just do not forget about it and let it boil dry!
When the can is dunked in the bucket of cold water, it is crushed very quickly, so have students gather around so they can see what happens. It is highly recommended that you practice this activity in advance.
If calculating pressures exerted at sea level is too difficult, it may be easier to provide the square areas 1-12 or perform the calculations using the air pressure in Denver (12 psi).
Activity Extensions
Have students do all their measurements and calculations in metric units. Use the following conversion factors:
1 cm2 = 0.001 m2
1 lb = 0.454 kg
1 in2 = 6.45 cm2 = 0.000645 m2
1 Pa = 1.45 x 10⁻⁴ lb/in2
1 kg mass weighs 9.8 N
Change the size of the grid students use to calculate the surface area of their feet. For example, use a 1 cm2 grid, or a ½ in2 grid.
Make a graph that shows how air pressure changes with altitude.
Relate the concepts explored in this activity to water pressure deep in the ocean.
Activity Scaling
Student Activity 1: The Strength of Air Pressure
- For grades 3 and 4, the multiplication and division may need to be modified; expect students to be able to do the multiplication with a calculator.
- For grades 1 and 2, conduct this activity as a class. Use tape and an index card to label items with the pressure that they exert, and have each student take a card. Ask students to arrange themselves (and the cards) in order of increasing pressure.
Student Activity 2: Air Pressure and Altitude
For grade 6 students:
- Rather than demonstrate the squares to the students, have them measure their own 1 x 1, 2 x 2, 3 x 3, and 4 x 4-inch square and find the pressure.
- The average surface area for an elementary school student is about 2,000 in2. Rather than telling students this information, have them calculate the amount of air pressure pushing down on them (24,000 lbs.).
- Have students calculate the force for other areas such as one square foot (144 in2), a football field (approx. 8,000,000 in2).
- Have students plot square inches vs. force on a graph.
- The average force of the atmosphere at sea level (New York City = 87 ft., San Diego = 13 ft. and Boston = 10 ft. — all close to sea level) is 15 pounds per square inch (almost 2 gallons of milk). Have students repeat their calculations for the pressure a sea level.
For grade 3 students:
- The average force of the atmosphere at sea level (New York City = 87 ft., San Diego = 13 ft. and Boston = 10 ft.—all close to sea level) is 15 pounds per square inch (almost 2 gallons of milk). Have students repeat their calculations for the pressure at sea level.
- Have students complete the Amount of Air Pressure on a Square - Worksheet 2, and make predictions for several other squares such as 100 x 100.
For grade 2 students, simplify the psi (pounds per square inch) from 12 to 10 for easier calculations.
Subscribe
Get the inside scoop on all things Teach Engineering such as new site features, curriculum updates, video releases, and more by signing up for our newsletter!More Curriculum Like This

Students build and observe a simple aneroid barometer to learn about changes in barometric pressure and weather forecasting.

Air pressure is pushing on us all the time although we do not usually notice it. In this activity, students learn about the units of pressure and get a sense of just how much air pressure is pushing on them.

Students learn about the fundamental concepts important to fluid power, which includes both pneumatic (gas) and hydraulic (liquid) systems.

Students learn about the underlying engineering principals in the inner workings of a simple household object – the faucet. Students use the basic concepts of simple machines, force and fluid flow to describe the path of water through a simple faucet.
References
Cunningham, J. and Herr, N. Hands-on Physics Activities with Real-Life Application. West Nyack, NY: The Center for Applied Research in Education, p. 188-210, 1994.
Quarter-Inch Graph Paper (printable). Copyright 2000-2004. Teacher Vision, Family Education Network, Pearson Education, Inc. (source of printable graph paper) Accessed on September 17, 2020. http://www.teachervision.com/lesson-plans/lesson-6169.html
Walpole, Brenda. 175 Science Experiments to Amuse and Amaze Your Friends. Random House, p. 72, 1988.
UNESCO. 700 Science Experiments for Everyone. New York, NY: Doubleday, p. 79, 1958.
Copyright
© 2004 by Regents of the University of ColoradoContributors
Amy Kolenbrander; Sharon Perez; Daria Kotys-Schwartz; Janet Yowell; Natalie Mach; Malinda Schaefer Zarske; Denise W. CarlsonSupporting Program
Integrated Teaching and Learning Program, College of Engineering, University of Colorado BoulderAcknowledgements
The contents of this digital library curriculum were developed under grants from the Fund for the Improvement of Postsecondary Education (FIPSE), U.S. Department of Education and the National Science Foundation (GK-12 grant no. 0338326). However, these contents do not necessarily represent the policies of the Department of Education or the National Science Foundation, and you should not assume endorsement by the federal government.
Last modified: September 17, 2020


User Comments & Tips