Quick Look
Grade Level: 8 (8-9)
Time Required: 1 hours 30 minutes
(can be split into two 45-minute sessions)
Expendable Cost/Group: US $1.00 (Cost is for washers, which are reusable)
Group Size: 4
Activity Dependency: None
Subject Areas: Data Analysis and Probability, Physical Science, Physics
NGSS Performance Expectations:

| MS-ETS1-4 |
Summary
Students learn about the role engineers and mathematicians play in developing the perfect bungee cord length by simulating and experimenting with bungee jumping using washers and rubber bands. Working as if they are engineers for a (hypothetical) amusement park, students are challenged to develop a show-stopping bungee jumping ride that is safe. To do this, they must find the maximum length of the bungee cord that permits jumpers (such as brave Washy!) to get as close to the ground as possible without going "splat"! This requires them to learn about force and displacement and run an experiment. Student teams collect and plot displacement data and calculate the slope, linear equation of the line of best fit and spring constant using Hooke's law. Students make hypotheses, interpret scatter plots looking for correlations, and consider possible sources of error. An activity worksheet, pre/post quizzes and a PowerPoint® presentation are included.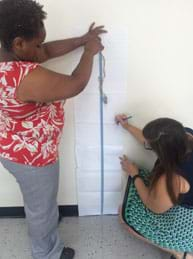
Engineering Connection
Engineers are involved in the planning and design of large and complex construction projects such as airports, tunnels, bridges, skyscrapers and amusement parks, and must effectively interact with and articulate their ideas and designs to other engineers. When designing a bungee cord ride, engineers must have a full understanding of the forces and materials as well as the concepts of overextension and tension in order to create designs that guarantee jumper safety. In this activity, students play the role of engineers as they design and test simulated bungee cords. Like engineers who put their math skills to work in their designs, students use linear equations when making plans for bungee cord use.
Learning Objectives
After this activity, students should be able to:
- Utilize collected data to construct scatter plots and find lines of best fit.
- Calculate the slope of a line, linear equation and spring constant (using Hooke's law).
- Measure displacement.
Educational Standards
Each TeachEngineering lesson or activity is correlated to one or more K-12 science,
technology, engineering or math (STEM) educational standards.
All 100,000+ K-12 STEM standards covered in TeachEngineering are collected, maintained and packaged by the Achievement Standards Network (ASN),
a project of D2L (www.achievementstandards.org).
In the ASN, standards are hierarchically structured: first by source; e.g., by state; within source by type; e.g., science or mathematics;
within type by subtype, then by grade, etc.
Each TeachEngineering lesson or activity is correlated to one or more K-12 science, technology, engineering or math (STEM) educational standards.
All 100,000+ K-12 STEM standards covered in TeachEngineering are collected, maintained and packaged by the Achievement Standards Network (ASN), a project of D2L (www.achievementstandards.org).
In the ASN, standards are hierarchically structured: first by source; e.g., by state; within source by type; e.g., science or mathematics; within type by subtype, then by grade, etc.
NGSS: Next Generation Science Standards - Science
| NGSS Performance Expectation | ||
|---|---|---|
|
MS-ETS1-4. Develop a model to generate data for iterative testing and modification of a proposed object, tool, or process such that an optimal design can be achieved. (Grades 6 - 8) Do you agree with this alignment? |
||
| Click to view other curriculum aligned to this Performance Expectation | ||
| This activity focuses on the following Three Dimensional Learning aspects of NGSS: | ||
| Science & Engineering Practices | Disciplinary Core Ideas | Crosscutting Concepts |
| Develop a model to generate data to test ideas about designed systems, including those representing inputs and outputs. Alignment agreement: | Models of all kinds are important for testing solutions. Alignment agreement: The iterative process of testing the most promising solutions and modifying what is proposed on the basis of the test results leads to greater refinement and ultimately to an optimal solution.Alignment agreement: | |
Common Core State Standards - Math
-
Model with mathematics.
(Grades
K -
12)
More Details
Do you agree with this alignment?
-
Look for and make use of structure.
(Grades
K -
12)
More Details
Do you agree with this alignment?
-
Reason abstractly and quantitatively.
(Grades
K -
12)
More Details
Do you agree with this alignment?
-
Construct and interpret scatter plots for bivariate measurement data to investigate patterns of association between two quantities. Describe patterns such as clustering, outliers, positive or negative association, linear association, and nonlinear association.
(Grade
8)
More Details
Do you agree with this alignment?
-
Investigate patterns of association in bivariate data.
(Grade
8)
More Details
Do you agree with this alignment?
-
Know that straight lines are widely used to model relationships between two quantitative variables. For scatter plots that suggest a linear association, informally fit a straight line, and informally assess the model fit by judging the closeness of the data points to the line.
(Grade
8)
More Details
Do you agree with this alignment?
-
Use the equation of a linear model to solve problems in the context of bivariate measurement data, interpreting the slope and intercept.
(Grade
8)
More Details
Do you agree with this alignment?
International Technology and Engineering Educators Association - Technology
-
Students will develop an understanding of the attributes of design.
(Grades
K -
12)
More Details
Do you agree with this alignment?
-
Students will develop an understanding of the relationships among technologies and the connections between technology and other fields of study.
(Grades
K -
12)
More Details
Do you agree with this alignment?
-
Create solutions to problems by identifying and applying human factors in design.
(Grades
6 -
8)
More Details
Do you agree with this alignment?
State Standards
New York - Math
-
Model with mathematics.
(Grades
Pre-K -
12)
More Details
Do you agree with this alignment?
-
Look for and make use of structure.
(Grades
Pre-K -
12)
More Details
Do you agree with this alignment?
-
Reason abstractly and quantitatively.
(Grades
Pre-K -
12)
More Details
Do you agree with this alignment?
-
Investigate patterns of association in bivariate data.
(Grade
8)
More Details
Do you agree with this alignment?
-
Construct and interpret scatter plots for bivariate measurement data to investigate patterns of association between two quantities. Describe patterns such as clustering, outliers, positive or negative association, linear association, and nonlinear association.
(Grade
8)
More Details
Do you agree with this alignment?
-
Know that straight lines are widely used to model relationships between two quantitative variables. For scatter plots that suggest a linear association, informally fit a straight line, and informally assess the model fit by judging the closeness of the data points to the line.
(Grade
8)
More Details
Do you agree with this alignment?
-
Use the equation of a linear model to solve problems in the context of bivariate measurement data, interpreting the slope and intercept.
(Grade
8)
More Details
Do you agree with this alignment?
New York - Science
-
Develop a model to generate data for iterative testing and modification of a proposed object, tool, or process such that an optimal design can be achieved.
(Grades
6 -
8)
More Details
Do you agree with this alignment?
Materials List
Each group needs:
- a washer (affectionately called "Washy") with a weight of ~100 g*; such as a 1-1/8-inch USS flat washer (1-1/4-inch inner diameter, 2-3/4-inch outer diameter and 11/64-inch thickness); alternatively, use two ¾-inch USS flat washers (13/16-inch inner diameter, 2-inch inner diameter and 5/32-inch thickness); *washer weights may vary and the activity will still work
- 15 - 20 rubber bands
- 1 large piece of paper, such as chart paper, at least 54 inches (137 cm) long
- masking tape
- measuring tape, at least 5 feet (152 cm) long
- (optional) calculator
- (optional) bin or box to organize materials by group
- (optional) paper and pencil for taking notes
- Pre-Activity Quiz, one per student
- Activity Worksheet, one per student
- Post-Activity Quiz, one per student
To share with the entire class:
- scale, to measure the weight of the washers
- computer with Internet access and projector to show an online video and the Create a Safe Bungee Cord for Washy! Presentation, a PowerPoint® file
Worksheets and Attachments
Visit [www.teachengineering.org/activities/view/nyu_bungee_activity1] to print or download.Pre-Req Knowledge
Students should have experience plotting points on x-y coordinate planes and calculating the equation of a line using y = mx + b and the slope of a line using: m = (y2-y1)/(x2-x1).
Introduction/Motivation
(Present to the class the following hypothetical story along with the online video and presentation, as described in the Procedure section.)
Izzy and Samayrus are studying to become engineers and are interning at a local theme park called Crazy Town. The executives at Crazy Town want Izzy and Samayrus to develop a show-stopping bungee jumping ride that is safe.
Now let's watch a video on bungee jumping. As you watch, record your observations: What do you see? What do you think about that? What does it make you wonder? (Show students the 5:11-minute video, Forces and Motion – Bungee Jumping at https://www.youtube.com/watch?v=RoLjKlHYvzA. While students are watching, circulate and read their answers.)
(Stop the video at 1 minute and 20 seconds.) Force is a push or a pull on an object. It results from one object's interaction with another. Unless it is opposed, a force changes the motion of an object. Write down the definition.
What information and/or physics concepts might be necessary to know in order to develop a show-stopping bungee jumping ride that is safe? Turn and talk to a partner. Jot down all your ideas. After three minutes, we will have a class discussion.
(Circulate and listen to student discussions. If students are off task, ask them to explain their ideas. After three minutes, begin a class discussion.)
What are your ideas? (Call on several students to share their ideas.)
Now back to our story. One issue that Izzy and Samayrus are concerned with is the impact of the bungee cord length on the distance of the jumper's fall. (Write "the impact of the bungee cord length on the distance of the jumper's fall" on the classroom board.) How does this concept relate to force?
(THINK: Have students write down the following question.) Write this down: Do you think that bungee cord length is an issue to consider when designing a bungee jump ride for Crazy Town? Please explain in writing, why or why not. (Circulate while students are writing. Ask students to explain their answers.)
(PAIR) Now pair up with another student and discuss your thoughts on this potential issue.
(SHARE) What are some of your ideas about bungee cord length?
(Continue with the story.) Today, the executives want you to predict and measure the distance that a jumper will fall for different bungee lengths. Remember, your bosses want this ride to be thrilling and safe!
Your task is to find the maximum length of the bungee cord that permits jumpers to get as close to the ground as possible (thrilling) without going "splat" (so they are safe)! You will record your data and use this information to find the total force acting on the bungee cord. Then you will use an equation we call Hooke's law to calculate the spring constant. You will also use scatter plots and linear equations to predict the maximum length of bungee cord for a safe fall and return.
Procedure
Teacher Background and Concepts
"Linear equation" has the word "line" in it; it is the equation for a straight line. An example linear equation is: y = 2x + 1. See Figure 1.
Students and teachers need to understand how to plot linear equations by plugging in x and y values. For example, given the equation y = 2x + 1:
1 = 2(0) + 1 when x is 0, y is 1.
3 = 2(1) + 1 when x is 1, y is 3
5 = 2(2) + 1 when x is 2, y is 5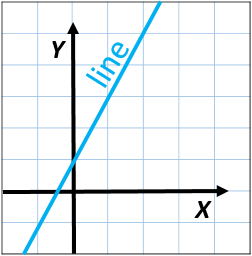
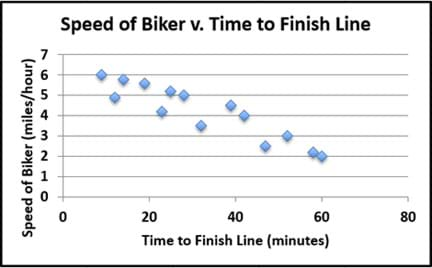
Scatter plots are similar to line graphs in that data points are plotted on a grid with x- and y-axes. Scatter plots show how one variable is related to another variable, which is called correlation. A positive correlation exists when the pattern of data points appears to have a positive slope (as the x-values increase, the y-values also increase; see Figure 2). In contrast, a negative correlation exists when the pattern of data points appears to have a negative slope (as the x-values increase, the y-values decrease; see Figure 3).
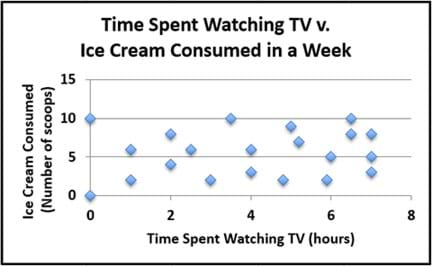
A high correlation exists when the pattern of data points looks like a straight line with either a positive or negative slope. A low correlation exists when the data points are more spread out, but still resemble a positive or negative slope. We say there is no correlation when no pattern exists between the variables (see Figure 4). 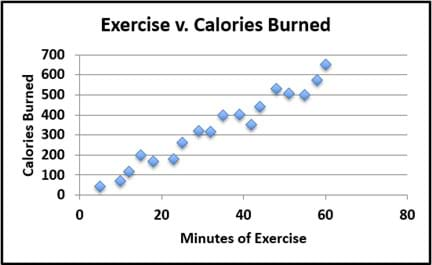
A line of best fit is a straight line on a scatter plot of data. The line may pass through all of the points, some of the points or none of the points, depending on the data. A line of best fit enables you to predict values not displayed on the scatter plot using the linear equation from the line of best fit.
Examine the incorrect and correct example lines of best fit in Figures 5, 6 and 7:
- Although the straight line in Figure 5 goes through numerous points on the scatter plot, it is not a good example of a line of best fit because the line is placed below a majority of the points.
- Although the line in Figure 6 has approximately the same number of points below the line as above the line, it is not a good line of best fit because the slope of the line does not follow the trend of the data points.
- Figure 7 is a great example of a line of best fit. The line is centered within the data points and the line's slope follows the trend of the slope of the points.
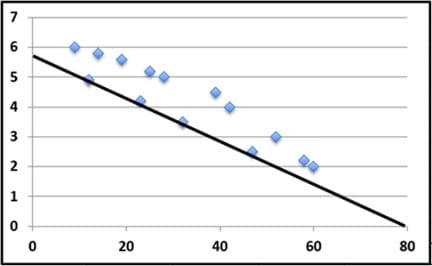
Figure 5. Incorrect line of best fit example #1. 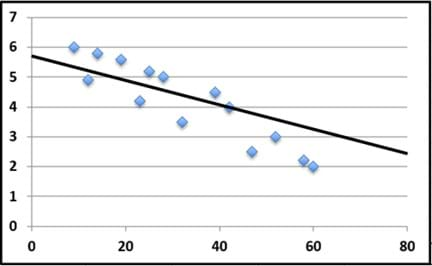
Figure 6. Incorrect line of best fit example #2. 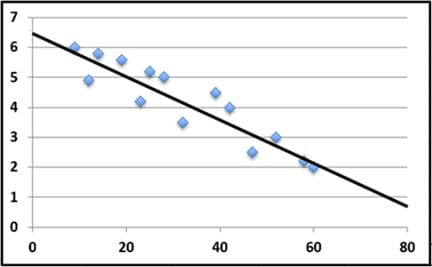
Figure 7. Example correct line of best fit.
In this activity, students create scatter plots and find the lines of best fit in order to understand the patterns in the data and be able to predict future values.
In bungee jumping, a bungee cord acts like a spring. To understand the properties of a spring, it helps to be familiar with Hooke's law, which is a linear equation. Hooke's law states that the force of an elastic object (such as a spring) is directly related to the displacement of the spring (how far the spring was stretched).
The equation for Hooke's law is F = -kx, where F = force (N), k = spring constant (N/m), and x = length of the displacement for the spring (m). The spring constant, k, characterizes the rigidity of the spring. A spring with a high k is considered highly rigid.
When a spring's elastic limit is reached, the spring becomes permanently distorted and no longer "springs" back. When relating bungee jumping to Hooke's law, both the cord strength and cord (maxed out) length must be considered. (Source: Physics 24/7; see the References section.)
The difference between tension (pulling) and extension is that tension leads to a more rigid elasticity of the spring and extension can lead to distortion of the string. For example, a stretched rubber band (adding tension) returns to its original shape. But if the rubber band is stretch using a great amount of force, it stretches so much that it is unable to return to its original shape. The amount of force required depends on the elasticity of the object.
Before the Activity
- Make copies of the Pre-Activity Quiz, Activity Worksheet and Post-Activity Quiz, one each per student.
- Prepare a bin for each group, each containing 15-20 rubber bands, 1 washer, tape, measuring tool and chart paper.
- Prepare to show the class the online video and the 27-slide Create a Safe Bungee Cord for Washy! Presentation, a PowerPoint® file.
With the Students—Pre-Quiz and Motivation (20 minutes)
- Administer the pre-activity quiz as described in the Assessment section. Collect the quizzes for a quick review. (3-5 minutes)
- (slides 1 and 2) Begin by presenting to the class the Introduction/Motivation section content, which is a hypothetical story that gives context for the engineering challenge. Make sure students have paper and pencils for writing down observations, ideas and notes. Then show the class a five-minute online video about bungee jumping, during which they write down their see/think/wonder ideas.
- (slide 3) Pause the video at 1 minute and 20 seconds. Clarify the definition of a force and have students write it down. (Optional: Play the rest of the video to further introduce students to air resistance and the equation: speed = distance / time.)
- (slide 4) After watching the video, direct students to turn and talk to a partner, brainstorming about what information and physics concepts might be necessary to know in order to develop a show-stopping bungee jumping ride that is safe. Have them jot down their ideas. Then lead a class discussion, calling on several students to share their ideas.
- (slide 5) Continue with the story. Write the key issue on the classroom board. How does the bungee cord length impact the distance of the bungee jump fall? How does this concept relate to force? Direct students in a think-pair-share approach to consider the issue, as guided by the slide text.
- (slide 6) Then continue with the story, which presents the engineering design challenge: To find the maximum length of the bungee cord that permits jumpers to get as close to the ground as possible (thrilling) without going "splat" (so they are safe)! As engineers, this requires some experimentation with the materials and some calculations and graphing.
With the Students—Introduction (25 minutes)
- (slides 7-10) Recap and discuss the objectives. Explain as necessary and have students take notes.
- (slide 10) Ask students to answer the following questions, then turn and talk to a partner about their answers: What do you know? What do you want to know?
- (slides 11 and 12) Quick notes and discussion: Introduce and explain some important concepts that students must know. Start by defining a linear equation and providing an example.
- (slides 13-17) Define scatter plots and correlations (positive, negative, none) with some examples (provided on the slides). Make the point that correlation does not imply causation.
- (slides 18-19) Describe Hooke's law and explain the equation.
- (slide 20) Describe and compare tension and overextension.
- (slide 21) Direct students in a think-pair-share examination of the concepts and vocabulary just presented.
With the Students—Experiment & Analysis (45 minutes)
- Divide the class into groups of four students each. Hand out the worksheets and supplies.
- Direct students to each formulate a hypothesis and write a prediction on the worksheet.
- While students follow the worksheet to run the experiment, circulate the room to help them along the way. Review their pre-quiz answers to learn of the strengths and weaknesses in their base knowledge. Below is an overview of the procedure that students follow to complete the experiment activity. See the worksheet for photographs, tables, graphs and more details.
- Set up the chart paper and measuring tape on the wall.
- Weigh the washer (in kilograms). Record the weight in Table 2.
- Attach two rubber bands to the washer as shown in the worksheet.
- Run the experiment for two rubber bands by having one student hold one end of the rubber band with one hand and drop the washer with the other hand from the jump line (top of the measuring tape). The other students in the group carefully observe the drop so as to note the farthest distance Washy falls and mark that distance on the chart paper.
- To obtain accurate data, students run several trials for each number of rubber bands and determine the average displacements. They record the displacements in centimeters in Table 1.
- Add additional rubber bands, running the experiment and recording the data for each trial in Table 1.
- Calculate force, using weight x gravity, and record the results in Table 2. (Gravity is 9.81 m/s2.)
- Convert the displacement for each trial from centimeters to meters and record the results in Table 2.
- Calculate the spring constants using Hooke's law and record the results in Table 2.
- Find the absolute values for the spring constants.
- Create a scatter plot using the number of rubber bands for the x-values and displacement in centimeters as the y-values (Table 1 data), and answer a few questions based on the scatter plot.
- Read about the line of best fit, including correct and incorrect examples. Then draw the lines of best fit on the scatter plots.
- Answer the five questions about slope and equations of lines and the six questions about interpreting data.
- Create a second scatter plot using displacement in meters for the x-values and the absolute value of the spring constant as the y-values (Table 2 data), and answer a few questions based on the scatter plot.
- (slides 22-27) Engage the class in a discussion to review the worksheet questions/answers on pages 6-8, as described in the Assessment section. Use the slides to help lead the discussion.
- (3-5 minutes) Exit slip: Administer the post-activity quiz, described in the Assessment section.
Vocabulary/Definitions
displacement: A measure of the change in an object's position. How far an object is out of place.
force: A push or a pull on an object. Unless it is opposed, a force changes the motion of an object.
Hooke's law: The relationship between the force applied to a spring and the displacement, which is the amount the object is stretched relative to its initial position. Fspring = -kx, where k is the spring constant and x is the displacement; k = pushing, while –k = pulling.
line of best fit: A way of representing scatter data using a straight line though the points for the purpose of predicting values.
overextension: A process that occurs when a certain threshold has been exceeded. For example, a spring that is stretched to a length from which it cannot return to its original shape.
scatter plot: Unconnected data points plotted on x- and y-axes that show values for two variables.
spring constant: A constant, abbreviated as "k" (with newton/meter for units) that defines spring stiffness. A stiff spring has a high spring constant, which means it takes a large amount of force to cause a small displacement.
tension: Pulling that leads to a more rigid elasticity of a spring.
Assessment
Pre-Activity Assessment
Pre-Quiz: To find out what students already know about the basic mathematical and scientific topics pertinent to this activity, administer the three-question Pre-Activity Quiz, which asks them to calculate the slope of a line, determine the equation of the line and describe what they know about force. Understanding how much students know about the basics of linear equations and slopes helps you anticipate how much assistance students may need when they are asked to perform related tasks during the activity. Force is a basic concept that students must understand in order to complete the activity. Refer to the Pre-Activity Quiz Answer Key.
Activity Embedded Assessment
Circulate and Track: During the activity, when students are working in groups of four, observe and informally assess their progress. As guided by the worksheet, students calculate Hooke's constant, graph their data as scatter plots, describe the correlation of the plots, draw lines of best fit, calculate the slopes and equations of the line, and analyze the data. At activity end, review the activity and cold call on several students to explain their answers. As a tracking device, attach the Teacher's Tracking System Handout on a clipboard and record small rating notes as you evaluate student understanding. Expect some students to require more time than others to complete the task. Be ready with related reading/mathematical analysis material for students who complete the task quickly.
Worksheet: As students are working, guided by the Activity Worksheet instructions, informally check on their progress by reading their answers to the worksheet questions. Ask students additional questions based on the work you observe. At activity end, review the answers as a class (refer to the Activity Worksheet Answer Key), and individually assess student comprehension by reviewing their worksheets.
Post-Activity Assessment
Exit Slip: To determine what students learned about the activity's basic mathematical and scientific topics, administer the two-problem Post-Activity Quiz, which asks them to determine a spring constant using Hooke's law, graph a line of best fit and determine the equation of the line. Review students' answers to gauge their depth of comprehension. Refer to the Post-Activity Answer Key.
Safety Issues
- Rubber bands can be dangerous if they break and hurt nearby students. Watch that students do not get off task by using the rubber bands in distracting and/or harmful ways.
- Watch that the washers are not thrown or placed in mouths.
Activity Scaling
- For lower grades, make the scatter plots together as a class.
- For higher grades, have students work in groups on the scatter plots.
Additional Multimedia Support
During the Introduction/Motivation section, show students a five-minute video on bungee jumping: Forces and Motion – Bungee Jumping at https://www.youtube.com/watch?v=RoLjKlHYvzA.
Subscribe
Get the inside scoop on all things Teach Engineering such as new site features, curriculum updates, video releases, and more by signing up for our newsletter!References
Computer Glossary, Computer Terms - Technology Definitions and Cheat Sheets. WhatIs.com - The Tech Dictionary and IT Encyclopedia. Accessed August 2015. http://www.whatis.techtarget.com
Henderson, Tom. The Physics Classroom. Accessed August 2015. http://www.physicsclassroom.com
Pierce, Rod. Linear Equations. 2013. Math Is Fun. Ed. Rod Pierce. Accessed August 2015. http://www.mathsisfun.com/algebra/linear-equations.html
Scatter Plots. Office for Mathematics, Science and Technology Education, College of Education, University of Illinois, Champaign, IL. Accessed August 2015. http://mste.illinois.edu/courses/ci330ms/youtsey/scatterinfo.html
See Think Wonder Routine. Visible Thinking, Harvard Project Zero. Accessed August 2015. http://www.visiblethinkingpz.org/VisibleThinking_html_files/03_ThinkingRoutines/03c_Core_routines/SeeThinkWonder/SeeThinkWonder_Routine.html
Taphorn, Amanda. Physics Tutorial: Bungee Jumping with Elastic Force. Physics 24/7, Kitchener, ON, Canada. Accessed August 2015. http://www.physics247.com/physics-tutorial/elastic-bungee-jumping.shtml
Copyright
© 2015 by Regents of the University of Colorado; original © 2015 Polytechnic Institute of New York UniversityContributors
Marc Frank; Ramona FittipaldiSupporting Program
SMARTER RET Program, Polytechnic Institute of New York UniversityAcknowledgements
This activity was developed by the Science and Mechatronics Aided Research for Teachers with an Entrepreneurial ExpeRience (SMARTER): A Research Experience for Teachers (RET) Program in the School of Engineering funded by National Science Foundation RET grant no. 1132482. However, these contents do not necessarily represent the policies of the NSF, and you should not assume endorsement by the federal government.
Last modified: November 26, 2020


User Comments & Tips