Quick Look
Grade Level: 4 (3-5)
Time Required: 1 hours 30 minutes
- 35-40 minutes (Day 1)
- 10 minutes for observation time (Days 2-4)
- 25 minutes for observations/questions/discussion (Day 5)
Expendable Cost/Group: US $2.00
Group Size: 3
Activity Dependency: None
NGSS Performance Expectations:

| 5-LS2-1 |
Summary
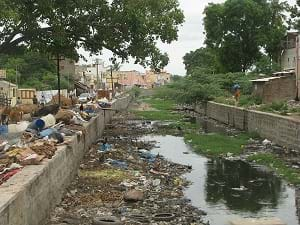
In this activity, students use models to investigate the process and consequences of water contamination on the land, groundwater, and plants. This is a good introduction to building water filters found in the associated activity, The Dirty Water Project.Engineering Connection
US Army Corps of Engineers (USACE) organization of civilian and military men and women provides both engineering and environmental services, such as water table analysis in various parts of the country. The USACE research is helpful in identifying and addressing water table issues, and providing policies and procedures that keep our water supplies safe.
Learning Objectives
After this activity, students should be able to:
- Describe how polluted water contaminates the land, groundwater and plants.
- Understand how contaminants leach into the soil and ground water and how they are absorbed by plants.
- Describe how drinking water can be affected by pollutants.
- Understand the role of engineers in water treatment systems.
Educational Standards
Each Teach Engineering lesson or activity is correlated to one or more K-12 science,
technology, engineering or math (STEM) educational standards.
All 100,000+ K-12 STEM standards covered in Teach Engineering are collected, maintained and packaged by the Achievement Standards Network (ASN),
a project of D2L (www.achievementstandards.org).
In the ASN, standards are hierarchically structured: first by source; e.g., by state; within source by type; e.g., science or mathematics;
within type by subtype, then by grade, etc.
Each Teach Engineering lesson or activity is correlated to one or more K-12 science, technology, engineering or math (STEM) educational standards.
All 100,000+ K-12 STEM standards covered in Teach Engineering are collected, maintained and packaged by the Achievement Standards Network (ASN), a project of D2L (www.achievementstandards.org).
In the ASN, standards are hierarchically structured: first by source; e.g., by state; within source by type; e.g., science or mathematics; within type by subtype, then by grade, etc.
NGSS: Next Generation Science Standards - Science
| NGSS Performance Expectation | ||
|---|---|---|
|
5-LS2-1. Develop a model to describe the movement of matter among plants, animals, decomposers, and the environment. (Grade 5) Do you agree with this alignment? |
||
| Click to view other curriculum aligned to this Performance Expectation | ||
| This activity focuses on the following Three Dimensional Learning aspects of NGSS: | ||
| Science & Engineering Practices | Disciplinary Core Ideas | Crosscutting Concepts |
| Develop a model to describe phenomena. Alignment agreement: Science explanations describe the mechanisms for natural events.Alignment agreement: | The food of almost any kind of animal can be traced back to plants. Organisms are related in food webs in which some animals eat plants for food and other animals eat the animals that eat plants. Some organisms, such as fungi and bacteria, break down dead organisms (both plants or plants parts and animals) and therefore operate as "decomposers." Decomposition eventually restores (recycles) some materials back to the soil. Organisms can survive only in environments in which their particular needs are met. A healthy ecosystem is one in which multiple species of different types are each able to meet their needs in a relatively stable web of life. Newly introduced species can damage the balance of an ecosystem. Alignment agreement: Matter cycles between the air and soil and among plants, animals, and microbes as these organisms live and die. Organisms obtain gases, and water, from the environment, and release waste matter (gas, liquid, or solid) back into the environment.Alignment agreement: | A system can be described in terms of its components and their interactions. Alignment agreement: |
International Technology and Engineering Educators Association - Technology
-
Models are used to communicate and test design ideas and processes.
(Grades
3 -
5)
More Details
Do you agree with this alignment?
-
Explain why responsible use of technology requires sustainable management of resources.
(Grades
3 -
5)
More Details
Do you agree with this alignment?
State Standards
Colorado - Science
-
Create and evaluate models of the flow of nonliving components or resources through an ecosystem
(Grade
4)
More Details
Do you agree with this alignment?
Materials List
For demonstration (one time set-up/use):
- 1 large, clear jar (large mayonnaise or pickle jars with wide mouths work well)
- 1 white or light-colored, thin sponge (cut in half)
- 1 eyedropper
- Water
- Sand (enough to fill jar about 1/2 of the way)
- 2 cups gravel (enough for approximately a 1" layer)
- Red food coloring
For preparation of "contamination" (for all groups to share):
- 2-3 gallons of water
- ½ cup sugar
- ½ cup salt
- ¼ cup black pepper
- 1 cup white vinegar
- 1 cup baking soda
- 1/8 cup dish soap
- 30 medium-sized, transparent, plastic cups or beakers
Each group should have:
- 2 white carnations
- 2 6" strips of masking tape
- 1 index card (to be used in advance by the teacher)
- Scissors
- 2 different colors of food coloring (groups may share)
- Teaspoon and tablespoon measuring spoons (or have several of each for groups to share)
- 2 cups water
- 3 copies of the What's Gotten Into You? – Data Contamination Sheet
Worksheets and Attachments
Visit [www.teachengineering.org/activities/view/cub_environ_lesson06_activity1] to print or download.Introduction/Motivation
Have you ever poured your leftover soda pop onto the grass when you are done with it? How about soapy water after you have just washed a car? What happens to that soda or water? Does it just disappear?
Have you ever been somewhere that when you took a drink of water from a fountain or sink and thought that it tasted bad? What did it taste like? What do you think made the water taste that way? Well, most of the pollutants in water are ones that we cannot see. Sometimes, pollutants are microscopic bacteria that can make us sick, and other times, they are chemicals that are added to the water by water treatment plants to make us healthy (such as, fluoride). Usually, we are told not to drink water from lakes or rivers because they might be polluted. What does that mean for the plants and animals that get their water from these lakes and rivers? Well, the bacteria and bad pollutants can make animals sick or kill plants, and subsequently, if we eat the plants or animals, the bacteria may then travel into our bodies and make us sick.
Imagine drinking water that tasted fine but was actually filled with contaminates that might build up in your body and make you sick after a few years. You might never know about it until it was too late to take preventative action! Fortunately, this rarely happens because environmental, civil and chemical engineers often participate in the water sampling and analysis process to ensure that your drinking water is safe.
Engineers also work to protect the water that is under the ground where we live. This underground water is called the water table, and it exists almost everywhere. Sometimes the water table is close to the surface of the ground, and it makes the ground soggy; other times, it is farther below, and we never even know it is there. Engineers know how to protect and use this water table to help keep our drinking water safe.
Today we are going to look at a demonstration that will show us how pollutants on the ground can travel into our water supply through the water table. Then, we will look at what some of those pollutants can do to plants. Engineers need to know about all of these factors before they can design and create the right water treatment technologies to help maintain safe water for public use and consumption.
In this activity, students will observe a demonstration of pollution entering a water table/aquifer. Then, student groups will set up an experiment where they look at the effects of different contaminants on carnations in water versus a carnation in plain water as a comparison, or control variable.
Procedure
Before the Activity
- Prepare the large jar: fill it halfway full with sand in the bottom and small gravel on top of the sand.
- Prepare "contamination" instruction cards by writing each of the following individual "recipes" on an index card. Each student group will receive one contamination card.
- Mix 1 teaspoon of sugar into each of your cups.
- Mix 1 Tablespoon of sugar into each of your cups.
- Mix 3 Tablespoons of sugar into each of your cups.
- Mix 1 teaspoon of salt and 1 teaspoon of pepper into each of your cups.
- Mix 1 Tablespoon of salt and 2 teaspoons of pepper into each of your cups.
- Mix 3 Tablespoons of salt and 1 Tablespoon of pepper into each of your cups.
- Mix 1 teaspoon of baking soda into each of your cups.
- Mix 1 Tablespoon of baking soda into each of your cups.
- Mix 3 Tablespoons of baking soda into each of your cups.
- Mix 1 teaspoon of vinegar into each of your cups.
- Mix 1 Tablespoon of vinegar into each of your cups.
- Mix 3 Tablespoons of vinegar into each of your cups.
- Mix 1 drop of dish soap into each of your cups.
- Mix 5 drops of dish soap into each of your cups.
(Note: Add cards for other suggestions of your own.)
- Prepare "contaminated" and plain water. Use food coloring to make about a gallon of darkly dyed water for contaminated water and another gallon of different colored water for "plain" water. (Note: it is helpful to color the plain water solution as well, so students can observe that water is moving through the stem of the carnation.)
- Review the water cycle with students. Pay special attention to the areas where water can become polluted. The Magic School Bus – Wet All Over: A Book About the Water Cycle, by Joanna Cole and Pat Relf (New York, NY: Scholastic Books, Inc., 1996) has a great description.
With the Students
Demonstration
- Distribute a Contamination Data Sheet to each student.
- Pour some plain water into the sand/gravel-filled jar (until the water level fills about half the remaining space of the jar, at least a few inches above the gravel line). Ask students to identify the water table (the area below represents the aquifer). (You may want to color the water orange or yellow so that it is easier to see.)
- Place a dry sponge on top of the gravel in the jar to represent a landfill.
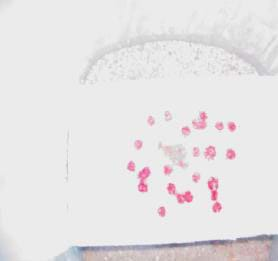
- With an eyedropper, carefully place 5-6 drops of food coloring on the sponge to represent the contamination in the landfill. (See Figure 1.)
- Ask students to predict what will happen to the "contamination" (food coloring) if you pour the water (representing rain) onto the sponge.
- Slowly pour about 1 cup of water onto the sponge.
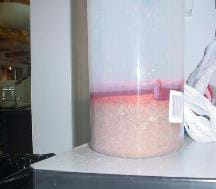
- Ask students to write down their observations of what happens next. Where does the food coloring (contamination) end up? (Answer: in the soil and ground water) Does all the contamination just go down into the soil at once? (Answer: No, it travels in little streams.) Does the contamination travel faster in the soil or the aquifer? (Answer: in the aquifer) Why do you think this happens? (See Figure 2.)
- Ask students to answer the questions in the Demonstration Section on their Contamination Data Sheet.
- Discuss with students how engineers would use the information they learned in this demonstration.
Group Activity
- Divide students into groups of 3.
- Distribute supplies to each group (2 transparent cups: one for one cup of plain water and the other for one cup of "contaminated" water; 2 white carnations; a mixing spoon; two pieces of masking tape; and a card with their "contamination" instructions).
- Ask students to record their "contamination instructions" on their data sheet. On one piece of their masking tape, ask them to write "Contamination" and stick it carefully on the outside of one of the plastic cups.
- Have students label the other piece of masking tape with "No Contamination" and place the masking tape on the outside of the second plastic cup.
- Ask groups to select one member to fill the cup labeled "No Contamination" with plain water (either from a classroom faucet or from a jug/bucket at a designated area in the classroom).
- Ask students to mix their contamination solutions, according to their "recipe" cards. (Note: set up 1-2 different stations and have groups go to the station 2 groups at a time to measure/mix their contaminations.) Remind them to measure their ingredients carefully and to wipe off the measuring spoon after its use. They should then proceed to the designated water station and add one cup of water to their contamination cup.
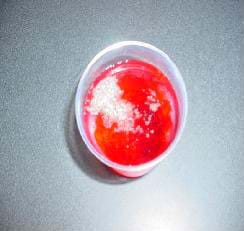
- Have groups add a different color of food coloring to each of their two cups of water. (Note: student should not mix colors; just add 2 drops of one color to one cup and another color to the second cup; see Figure 3.)
- Tell students that they will eventually be putting their carnations in each cup of water. Ask them to write a prediction about what will happen to the carnation as it sits in each cup.
- Have groups carefully cut the stems of the carnations so they are about 6 inches long. Then have them place the stem of one carnation in each of the contaminated and non-contaminated cups of water, as in Figure 4.
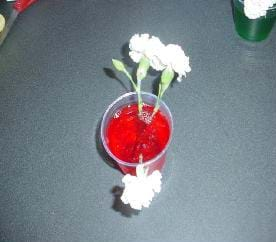
- Ask them to write down their observations for Day 1 on the Data Contamination Sheets.
- Ask students to record their observations of the interaction between the solutions and the carnations each day for a week. (How have the solutions and carnations changed? Ask them to consider why this is happening. You may want to discuss some of the results as a class.) Note: two of the days will be weekend days, and the students can just cross those days off.
- After writing down their last observations (on Day 7), ask the students to answer the questions at the end of their Data Collection Worksheet.
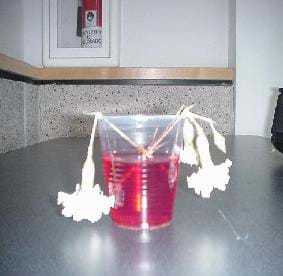
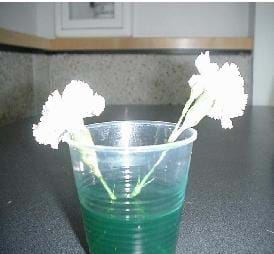
- At the end of the observation period, ask the class which carnation they think was the least affected? Why? Which on was the most affected? How was it affected? Why do you think this happened? (Answer: They will most likely say the other ingredients in the water caused the problems, but try to get them to explain exactly what they think their specific ingredient does to the flower.)
- If time permits, have each student group show their carnations and explain the pollution present in their contaminated water. As a class, discuss the effects of the different "contaminations."
- Run the Post-Activity Assessment as described in the Assessment Section below.
Assessment
Pre-activity assessment
Predictions: Using the appropriate spaces in the attached What's Gotten Into You? – Data Collection Worksheet, have students predict what will happen in both the demonstration and the activity.
Activity embedded assessment
Observations: Using the What's Gotten Into You? – Data Collection Sheet, have students record their observations of the activity for one week.
Post-activity assessment
Inside/Outside Circle: Have the students stand in two circles such that each student has a partner. Three people may work together if necessary. The outside circle faces in and the inside circle faces out. Ask the students one of the questions from the end of the What's Gotten Into You? – Data Collection Worksheet or below. Both members of each pair think about the question and discuss their answers. If they cannot agree on an answer, they can consult with another pair. Call for responses from the inside or outside circle or the class as a whole.
- How can we use what we learned to help us understand real life problems? (Answer: It helps us understand how pollutants are transferred from water to other systems so that we better know how to prevent the transfer; so that the rest of the food chain is not also affected.)
- Summarize what each of the experiments (demonstration and group) taught us. (Possible answer: Pollution present in water contaminates other systems: the ground, ground water and plant life.)
- How do pollutants get into our water supply? (Answer: Some pollutants get there by leaching through the ground during rainstorms.)
- How do engineers help clean up pollutants in water? (Answer: Environmental, civil and chemical engineers design technologies and treatment facilities to ensure that drinking water is safe. Also, engineers know how to protect and use this water table to help keep that water safe.)
Safety Issues
Remind students to never taste or touch unknown (or known) toxic chemicals.
Tell students to use caution when cutting the stems of the carnations, as the scissors may slip when cutting, and the ends of the stems may fly across the desk/room.
Troubleshooting Tips
Be sure to have paper towels/rags on hand in-case spills occur.
The carnations will last longer if you store the cups in a cool location.
Tell students not to mix food coloring or they could wind up with cups of black water.
Activity Extensions
Have students use pH paper and a pH guide to help them determine the pH of the solutions each day. Compare the pH of the different solutions and the pH of a single solution on different days. Discuss why they are the same or different. Discuss how the different items in the solution affect the pH. How would the pH of the solution affect the rest of the environment? (Refer to the pH table)
Have the students observe the effects of contaminated water on the carnation without knowing what the contamination is. Ask them to compare/contrast the effects and group them into categories. Challenge them to guess which solution they had.
Ask students to suggest their own solutions to test and then test them.
Do the Parts Per Million (Billion) Activity, found in Water: A Resource in Crisis (by Eileen Lucas, Children's Press, Inc., Chicago, 1991). Look up water quality standards at the EPA website (https://www.epa.gov). Compare the data to what was learned in the demonstration.
Students can try dying the carnations at home with different colors for fun.
Activity Scaling
For 3rd grade students, pre-measure the ingredients for the solutions. Limit the types of solution to sugar and salt. Focus observations on only a couple of things (like color and "droopiness").
For 4th grade students, do activity as is.
For 5th grade students, use milliliters (mL) to measure ingredients instead of teaspoons/ tablespoon measurements.
Subscribe
Get the inside scoop on all things Teach Engineering such as new site features, curriculum updates, video releases, and more by signing up for our newsletter!More Curriculum Like This

Students are introduced to the concepts of air pollution, air quality, and climate change. The three lesson parts (including the associated activities) focus on the prerequisites for understanding air pollution. First, students use M&M® candies to create pie graphs that express their understanding o...

Students learn about several possible scenarios of contamination to drinking water, which comes from many different sources, including surface water and groundwater. They analyze the movement of sample contaminants through groundwater, in a similar way to how environmental engineers analyze the phys...

Through the use of models and scientific investigation, students explore the causes of water pollution and its effects on the environment. Through the two associated activities, they investigate filtration and aeration processes that are used for removing pollutants from water.
References
Cole, Joanna and Relf, Pat. The Magic School Bus – Wet All Over: A Book About the Water Cycle, New York, NY: Scholastic Inc., 1996 (ISBN 0-590-50833-4).
Lucas, Eileen. Water: A Resource in Crisis, Chicago: Children's Press, Inc., 1991.
US Environmental Protection Agency, http://www.epa.gov.
Copyright
© 2005 by Regents of the University of Colorado.Contributors
Amy Kolenbrander; Jessica Todd; Malinda Schaefer Zarske; Janet YowellSupporting Program
Integrated Teaching and Learning Program, College of Engineering, University of Colorado BoulderAcknowledgements
The contents of this digital library curriculum were developed under a grant from the Fund for the Improvement of Postsecondary Education (FIPSE), U.S. Department of Education and National Science Foundation GK-12 grant no. 0338326. However, these contents do not necessarily represent the policies of the Department of Education or National Science Foundation, and you should not assume endorsement by the federal government.
Last modified: August 6, 2020





User Comments & Tips