Quick Look
Summary
Students use Arduino microcontrollers to measure heart rate and blood oxygen levels with the MAX30102 sensor board and to capture electrocardiogram (ECG) signals using the AD8232 sensor board. They analyze the data to detect arrhythmias by comparing results from both sensors. Throughout the activity, students gain hands-on experience with installing the Arduino Integrated Development Environment (IDE), adding libraries, compiling code, and running programs on Arduino microcontrollers.Engineering Connection
Engineers use microcontrollers and sensors to develop diagnostic tools for healthcare applications. These devices are often portable, compact, low-cost, and energy-efficient. In addition to these advantages, they offer accurate and precise real-time data. Engineers apply mathematical formulas to analyze this data and calculate key values that assist doctors in diagnosing various medical conditions. This type of work falls under biomedical engineering, a field that combines electrical, mechanical, chemical, and materials engineering with biology to design and improve medical technologies. Examples of biomedical instruments include patient monitors (such as ECG, heart rate, and oxygen sensors), thermometers, infant incubators, anesthesia machines, ventilators, defibrillators, electrosurgical units, dialysis machines, syringe pumps, and physiological monitoring systems.
Learning Objectives
After this activity, students should be able to:
- Describe the timing and peaks of the electrocardiogram (ECG) signal in relation to heart muscle function.
- Capture heart rate, blood oxygen level, and ECG signals using sensors.
- Calculate heart rate from the ECG signal.
Educational Standards
Each TeachEngineering lesson or activity is correlated to one or more K-12 science,
technology, engineering or math (STEM) educational standards.
All 100,000+ K-12 STEM standards covered in TeachEngineering are collected, maintained and packaged by the Achievement Standards Network (ASN),
a project of D2L (www.achievementstandards.org).
In the ASN, standards are hierarchically structured: first by source; e.g., by state; within source by type; e.g., science or mathematics;
within type by subtype, then by grade, etc.
Each TeachEngineering lesson or activity is correlated to one or more K-12 science, technology, engineering or math (STEM) educational standards.
All 100,000+ K-12 STEM standards covered in TeachEngineering are collected, maintained and packaged by the Achievement Standards Network (ASN), a project of D2L (www.achievementstandards.org).
In the ASN, standards are hierarchically structured: first by source; e.g., by state; within source by type; e.g., science or mathematics; within type by subtype, then by grade, etc.
NGSS: Next Generation Science Standards - Science
| NGSS Performance Expectation | ||
|---|---|---|
|
HS-ETS1-1. Analyze a major global challenge to specify qualitative and quantitative criteria and constraints for solutions that account for societal needs and wants. (Grades 9 - 12) Do you agree with this alignment? |
||
| Click to view other curriculum aligned to this Performance Expectation | ||
| This activity focuses on the following Three Dimensional Learning aspects of NGSS: | ||
| Science & Engineering Practices | Disciplinary Core Ideas | Crosscutting Concepts |
| Analyze complex real-world problems by specifying criteria and constraints for successful solutions. Alignment agreement: | Criteria and constraints also include satisfying any requirements set by society, such as taking issues of risk mitigation into account, and they should be quantified to the extent possible and stated in such a way that one can tell if a given design meets them. Alignment agreement: Humanity faces major global challenges today, such as the need for supplies of clean water and food or for energy sources that minimize pollution, which can be addressed through engineering. These global challenges also may have manifestations in local communities.Alignment agreement: | New technologies can have deep impacts on society and the environment, including some that were not anticipated. Analysis of costs and benefits is a critical aspect of decisions about technology. Alignment agreement: |
| NGSS Performance Expectation | ||
|---|---|---|
|
HS-ETS1-2. Design a solution to a complex real-world problem by breaking it down into smaller, more manageable problems that can be solved through engineering. (Grades 9 - 12) Do you agree with this alignment? |
||
| Click to view other curriculum aligned to this Performance Expectation | ||
| This activity focuses on the following Three Dimensional Learning aspects of NGSS: | ||
| Science & Engineering Practices | Disciplinary Core Ideas | Crosscutting Concepts |
| Design a solution to a complex real-world problem, based on scientific knowledge, student-generated sources of evidence, prioritized criteria, and tradeoff considerations. Alignment agreement: | Criteria may need to be broken down into simpler ones that can be approached systematically, and decisions about the priority of certain criteria over others (trade-offs) may be needed. Alignment agreement: | |
| NGSS Performance Expectation | ||
|---|---|---|
|
HS-ETS1-4. Use a computer simulation to model the impact of proposed solutions to a complex real-world problem with numerous criteria and constraints on interactions within and between systems relevant to the problem. (Grades 9 - 12) Do you agree with this alignment? |
||
| Click to view other curriculum aligned to this Performance Expectation | ||
| This activity focuses on the following Three Dimensional Learning aspects of NGSS: | ||
| Science & Engineering Practices | Disciplinary Core Ideas | Crosscutting Concepts |
| Use mathematical models and/or computer simulations to predict the effects of a design solution on systems and/or the interactions between systems. Alignment agreement: | Both physical models and computers can be used in various ways to aid in the engineering design process. Computers are useful for a variety of purposes, such as running simulations to test different ways of solving a problem or to see which one is most efficient or economical; and in making a persuasive presentation to a client about how a given design will meet his or her needs. Alignment agreement: | Models (e.g., physical, mathematical, computer models) can be used to simulate systems and interactions—including energy, matter, and information flows—within and between systems at different scales. Alignment agreement: |
Common Core State Standards - Math
-
Reason abstractly and quantitatively.
(Grades
K -
12)
More Details
Do you agree with this alignment?
-
Model with mathematics.
(Grades
K -
12)
More Details
Do you agree with this alignment?
-
Summarize, represent, and interpret data on a single count or measurement variable
(Grades
9 -
12)
More Details
Do you agree with this alignment?
Materials List
Each student needs:
Each group needs:
- 1 Arduino Kit UNO R3 Nano V3.0 2560 Mega 328 Project Starter 85 Pcs/Set
- breadboard and jumper wires (included in Arduino kit)
- 1 MAX30102 Heart Rate Sensor Module Pulse Detection Blood Oxygen Concentration Test
- 1 AD8232 Module ECG Sensor Kit Heart Rate Monitor Measurement with Electrode Line DC3.3V,
- 3m Red Dot Monitoring Electrode - Model 2560
- 1 laptop or computer
- 1 stopwatch or cell phone with timer capability
- 1 Microcontroller Program Sheet
- Access to the Microcontrollers for Medical Use PowerPoint
For the class to share:
- 1 laptop or computer and projector with internet access (to display PowerPoint and show YouTube videos)
Worksheets and Attachments
Visit [www.teachengineering.org/activities/view/mis-2924-microcontroller-instruments-medical-use-activity] to print or download.Pre-Req Knowledge
Students should be familiar with ECG, heart rate, types of arrhythmia (tachycardia and bradycardia), and blood oxygen levels.
Introduction/Motivation
Have you ever wondered how engineers help doctors “see” what is happening inside your body, or how wearable tech like smartwatches can track your heartbeat and oxygen levels in real time? In this activity, you will take on the role of a biomedical engineer and design functional tools used in health monitoring and diagnosis.
You will work with Arduino, an open-source microcontroller platform that engineers use to build and prototype electronic systems ranging from smart home devices to robots and medical instruments. In this project, you will use Arduino to create a system that measures and analyzes heart activity and oxygen levels—just like the technology inside hospital monitors and fitness wearables.
Using two industry-relevant sensors, you will gather data from your own body. The MAX30102 sensor will measure your heart rate and blood oxygen saturation (SpO₂), while the AD8232 sensor will capture your ECG signal, the electrical patterns your heart creates with every beat. You will analyze these signals to detect conditions such as tachycardia (fast heart rate), bradycardia (slow heart rate), or low oxygen levels that might affect health.
Along the way, you will write and upload code, wire electronic components, and design a custom housing unit for your circuit—just like engineers who develop compact, wearable health tech. You will also troubleshoot, test, and refine your design to improve performance and usability.
This activity is not just about learning: It’s about engineering a real-world solution. You will leave with hands-on experience in programming, circuit design, data analysis, and prototyping, skills used every day in biomedical engineering.
Are you ready to engineer a system that brings health data to life? Let’s build, test, and explore!
Procedure
Background
In recent years, the Arduino platform has been widely applied in the development of electronic instruments, offering an accessible and affordable toolset for creating healthcare devices, particularly heart rate monitors and blood oxygen sensors. These devices are compact, low-cost, and user-friendly, making them well-suited for real-time monitoring and diagnosis in clinical and research settings.
Arduino boards, when integrated with electronic sensors, can accurately measure physiological parameters such as pulse rate and blood oxygen saturation. But what exactly are Arduino, ECG signals, and heart rate? Arduino is a popular open-source microcontroller platform used for building interactive electronic projects. Its versatility and ease of use make it ideal for rapid prototyping and educational applications.
An electrocardiogram (ECG or EKG) is a non-invasive diagnostic tool that measures the electrical activity of the heart. It records signals using electrodes placed on the skin and displays them as a wave-like graph. The typical ECG graph includes the P wave, QRS complex, and T wave, which correspond to various stages of the cardiac cycle. The P wave represents atrial contraction, the QRS complex indicates ventricular contraction, and the T wave reflects the recovery of the ventricles. By analyzing these waveforms, healthcare professionals can identify irregular heart rhythms, detect heart attacks, and monitor overall cardiac health.
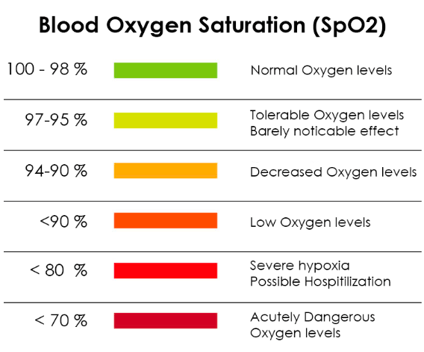
Blood oxygen level refers to the amount of oxygen carried by hemoglobin in red blood cells, typically expressed as oxygen saturation (SpO₂). Normal arterial oxygen saturation levels range from 95% to 100%. Monitoring SpO₂ is important for identifying respiratory or cardiovascular conditions that affect how well oxygen is delivered throughout the body.
Heart rate refers to the number of heartbeats per minute (bpm). A typical resting heart rate for adults ranges from 60 to 100 bpm. However, athletes and highly fit individuals may have resting rates between 40 and 60 bpm, which is not necessarily abnormal. Heart rate can fluctuate with activity, stress, medications, or illness, and it serves as a useful indicator of cardiovascular function.
An arrhythmia is an irregular heartbeat, often caused by abnormal electrical signals in the heart. Two common types are tachycardia and bradycardia. Tachycardia occurs when the heart beats too fast—over 100 bpm at rest—and may result from exercise, stress, fever, or heart problems. Sustained tachycardia can affect the heart’s ability to pump blood efficiently. Bradycardia, on the other hand, occurs when a resting heart rate is below 60 bpm. While it may be normal in some people, it can also be associated with aging, certain medications, or heart conditions, and may cause fatigue, dizziness, or fainting.
Blood oxygen levels (SpO₂) are typically measured using a pulse oximeter, which uses light to estimate oxygen saturation through the fingertip. Levels below 90% may indicate hypoxemia, a condition where the blood contains low levels of oxygen and can lead to hypoxia, a condition where the body’s tissues and organs are not receiving enough oxygen. This could signal issues such as asthma, pneumonia, COPD, or heart failure. Monitoring oxygen saturation is particularly important for individuals with chronic respiratory or cardiovascular diseases.
In this activity, students will connect AD8232 and MAX30102 sensors to an Arduino microcontroller to measure ECG signals, heart rate, and blood oxygen levels. Students will use their data to identify possible irregular heart rhythms, such as tachycardia (heart rate above 120 bpm) and bradycardia (below 60 bpm), as well as detect potentially low oxygen saturation (below 90%).
Before the Activity
- Gather the materials needed for the activity.
- Make copies of the Pre-Assessment and Activity Worksheet for each student.
- Suggested teacher preparation:
- Part 1: Read and watch videos for background information (e.g., Slides 2–8 of the Microcontrollers for Medical Use PowerPoint).
- Part 2: Practice setting up and programming the Arduino.
- Part 3: Practice measuring heart rates and oxygen levels.
- Part 4: Practice capturing the ECG signal.
During the Activity
Part 1: Introduction (50 minutes)
- Distribute the Pre-Assessment to each student.
- Allow 15 minutes for students to complete the worksheet.
- Display the Microcontrollers for Medical Use PowerPoint for the class.
- Introduce the activity using Slide 2.
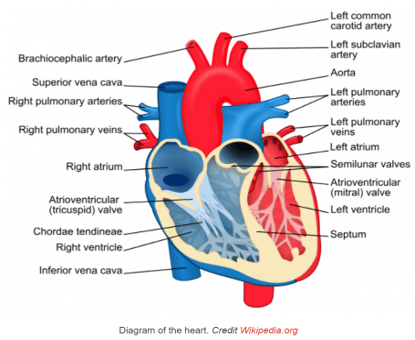
- As a class, read the background slides about ECG, blood oxygen, and heart rate measurements.
- Show Slide 3, highlighting the heart’s components and ECG parts.
- Play the YouTube video in Slide 4: https://www.youtube.com/watch?v=ocSd7opNFD8 (4:12 minutes).
- Read the ECG cycle breakdown on Slides 5 and 6.
- Walk through the ECG example on Slide 7.
- Review blood oxygen levels on Slide 8.
- Optional: Review and discuss answers to the Pre-Assessment with the class.
Part 2: Understanding the Arduino microcontroller (50 minutes)
- Divide the class into groups of two students.
- As a class, read Slides 9 and 10 of the Microcontrollers for Medical Use PowerPoint.
- Show the full video on Slide 10: https://youtu.be/iSTZ8vNMpTM (2:24 minutes).
- Have each pair start the video again and follow along, pausing as needed, to download and install the Arduino IDE on their computers. This link (also found on slide 9 of the presentation) contains IDE installation information: https://docs.arduino.cc/resources/datasheets/A000066-datasheet.pdf.
- Optional: Watch the video together as a class while you demonstrate each step, pausing for students to replicate the process.
- Circulate and check that each group’s Arduino IDE setup is correct and working.
- Distribute the Activity Worksheet to each student.
- Have students write or copy/paste code that turns an LED ON for 300 ms, OFF for 100 ms, ON for 500 ms, and OFF for 500 ms. Sample code can be found on the Activity Worksheet Answer Key under Part 2. Students should record their code on their Activity Worksheet.
- For reference, the following Teach Engineering activity provides a deeper dive into this content: https://www.teachengineering.org/activities/view/nyu_physical_computing_activity1
Part 3: Understanding the MAX30102 Spectrometer (50 minutes)
- Divide the class into pairs.
- Have students read Slides 11–14 for background on the MAX30102 spectrometer.
- Have each pair watch the video on Slide 14: https://www.youtube.com/watch?v=MHPgamGQmDY (7:36 minutes).
- Ask each student to explain the importance of red light, infrared light, and the optical sensors used to measure blood oxygen levels in the MAX30102. Have students write their explanations in their Activity Worksheet.
- Distribute and prepare breadboards, jumpers, and MAX30102 sensors for each group.
- Show the video on Slide 15, https://www.youtube.com/watch?v=V5UvNVQsUsY&t=2s (3:01 minutes), demonstrating how to connect the Arduino to the MAX30102 sensor.
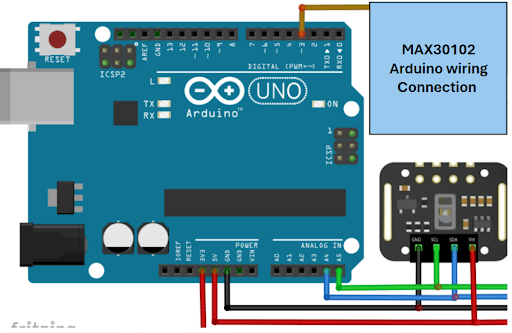
- Guide students to connect the MAX30102 sensor to the Arduino following this wiring table and the circuit diagram on Slide 11:
Arduino MAX30102 3.3V VIN GND GND Arduino MAX30102 A4 SCL A5 SDA - Assist students in connecting their Arduinos to the MAX30102 sensors to measure oxygen level and heart rate:
- Install the required library for the MAX30102 sensor.
- Use the Arduino IDE: go to Tools → Manage Libraries → search for “MAX30102” → install the SparkFun MAX30102 library. This link (also found on Slide 15 of the presentation) contains helpful information for doing this: https://www.youtube.com/watch?v=V5UvNVQsUsY&t=2s
- Open File → Examples → SparkFun MAX30102.
- Have students copy, paste, and run Example 5 (Program 1) on their Microcontroller Program Sheet.
- Compile and run the example.
- Open the Serial Monitor (Tools → Serial Monitor) to view the heart rate (HR) data.
-
Have students open the Serial Monitor to capture their heart rate data.
-
Guide students to paste and run Program 2 from the Microcontroller Program Sheet to measure both oxygen level and heart rate (students should place their finger on the sensor during measurement). - Make sure students save or take screenshots of their heart rate and oxygen level readings.
Part 4: Understanding the AD8232 Sensor (50 minutes)
- Divide the class into pairs.
- Review Slides 3-7 as a class.

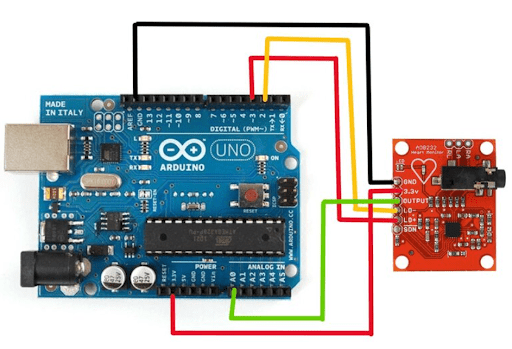
- Have students watch the video on Slide 16, https://www.youtube.com/watch?v=01y_Vu_sAQU&t=463s (8:59 minutes), which demonstrates how to connect the AD8232 sensor to the Arduino (refer to Figure 4).
- Have students connect the AD8232 ECG sensor to the Arduino using the circuit diagram on Slide 16, following this wiring table:
| Arduino | AD8323 |
| 3.3V | 3.3V |
| GND | GND |
| A0 | OUTPUT |
| 2 | LO- |
| 3 | LO+ |
- Have students copy and paste the code from Slide 18 or use Program 3 from the Microcontroller Program Sheet.
- Instruct students to attach the ECG pads and leads as shown in video (refer to Figure 5).
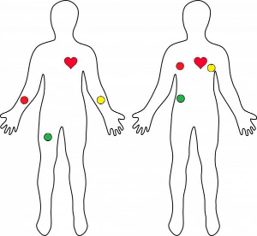
- Guide students to open Serial Plotter or Monitor to visualize the ECG data.
- Set a timer for 15 seconds. Have students count the number of peaks (heartbeats) shown on the graph.
- Show students that they can calculate HR = 4 × number of peaks in 15 seconds.
- Remind students to record the ECG graph, voltage values, and calculated HR.
- Once each group can accurately record an ECG graph, have each group test both MAX30102 and AD8232 sensors on three different students.
- Explain that students should record the oxygen level and HR using MAX30102 in their Activity Worksheet.
- Show the class how to calculate heart rate with the AD8232 data using HR = 4 × peaks per 15 seconds.
- Make sure students complete the data table in the Activity Worksheet with all measurements.
Part 5: Conclusion (50 minutes)
- Give students time to finish collecting their data.
- Give students time to answer the reflection questions in the Activity Worksheet.
- Discuss as a class: Why might HR readings differ between the two sensors?
- Wrap up with class discussion reflecting on their favorite part or biggest learning takeaway.
Vocabulary/Definitions
arrhythmia : A problem with the rate or rhythm of the heart.
atrial: The upper chamber of the heart.
bradycardia : A type of abnormal heart rhythm, or arrhythmia, where the heart beats more slowly than normal.
breadboard: A construction base used to build electronic circuits.
electrocardiogram (ECG): A test to record the electrical signals in the heart.
electrocardiogram (ECG) signal: A signal generated from an electrocardiogram.
Assessment
Pre-Activity Assessment
Pre Assessment Worksheet: Students complete the Pre-Assessment, which covers definitions of the following: ECG, heart rate, oxygen level, arrhythmia, tachycardia, bradycardia, and Arduino. This helps you assess students’ current knowledge.
Comprehension questions: Students explain the importance of red light, infrared light and the optical sensors to measure blood oxygen rate in MAX30102 in their Activity Worksheet.
Activity Assessment
Microcontroller Programming: Students download the IDE for their Arduino microcontroller and then implement programs to toggle a light emitting diode (LED) on and off with different delay times.
Using the MAX30102 sensor: Students connect their Arduino to the MAX30102 sensor and then program their microcontroller to get measurements of oxygen level and heart rate.
Post-Activity (Summative) Assessment
Reflection questions: Students answer questions reflecting on the reasons for getting different HR values for the same student and how they can improve the design to get more accurate results.
Troubleshooting Tips
- Present the activity step-by-step, pausing frequently to check for understanding.
- Make sure all students have completed each step successfully before moving on.
- Provide hands-on guidance during the coding and wiring process.
- Encourage questions and clarify any confusion along the way.
Activity Extensions
Design Housing
- Brainstorm housing box designs for MAX30102 and AD8232 setups.
- Discuss design constraints (size, port access, measurement windows).
- Use cardboard, design software, or 3D printing tools to begin prototyping two separate housings.
- Encourage sketches, measurement notes, and teamwork.
- Optional: Start initial construction or modeling of housing.
- Ask students to determine which device seems more accurate and explain why.
- Brainstorm improvements to device setup, code, or design for better accuracy.
- Have groups exchange their housing boxes with another team.
- Test the other group’s housing and give written feedback on the following:
- Port access
- Finger placement
- Portability
- Measurement ease
Activity Scaling
For lower grades:
- Focus on just one sensor (e.g., MAX30102 pulse oximeter) instead of both the pulse oximeter and ECG sensor.
- Use only parts of the PowerPoint and videos—skip the deeper technical slides and detailed coding examples.
- Provide pre-written code snippets to copy/paste instead of writing code from scratch.
- Focus on understanding sensor connections and data reading rather than coding logic.
- Shorten or omit background videos and some of the code writing, focusing instead on guided demonstrations.
For older/ advanced students:
- Include additional sensors or data analysis (e.g., ECG waveform analysis, filtering noise, or programming additional features).
- Introduce more detailed discussions about physiology or electronics.
- Add challenges such as modifying the code or building enclosures for the sensors.
- Encourage students to write their own code or troubleshoot sensor issues independently.
- Add extension projects such as creating a simple health monitoring dashboard or combining sensor data.
Subscribe
Get the inside scoop on all things Teach Engineering such as new site features, curriculum updates, video releases, and more by signing up for our newsletter!More Curriculum Like This

Students learn how the heart functions. They are introduced to the concept of action potential generation, which causes the electrical current that triggers muscle contraction in the heart.
Copyright
© 2025 by Regents of the University of Colorado; original © 2024 Michigan State UniversityContributors
Researching instructor: Dr. Thamira Hindo1 Faculty Advisor: Dr. Zhen Que2, Graduate Assistant: Anirban Chakraborty2 P.I: Dr. Wen-Li, Co-P.I Drew Kim, Michigan State University Mentor: Matt Jourden, Brighton High School Brighton, MISupporting Program
RET Program, College of Engineering, Michigan State UniversityAcknowledgements
This curriculum was developed through the Michigan State University College of Engineering NSF RET program under grant number 1609339. However, these contents do not necessarily represent the policies of the NSF, and you should not assume endorsement by the federal government.
Special thanks to the director, curriculum experts, and staff for answering our questions.
Last modified: September 16, 2025




User Comments & Tips