Quick Look
Grade Level: 10 (9-12)
Time Required: 1 hours 45 minutes
(two 50-minute classes)
Expendable Cost/Group: US $0.00 This activity require the use of some non-expendable (reusable) items such as LEGO® MINDSTORMS® NXT robot, sensors and software; see the Materials List for details.
Group Size: 4
Activity Dependency: None
Subject Areas: Biology, Measurement
NGSS Performance Expectations:

| HS-LS1-2 |
| MS-LS1-8 |
Summary
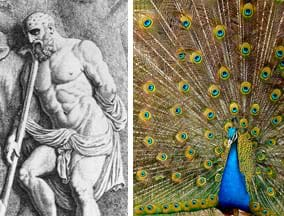
Vision is the primary sense of many animals and much is known about how vision is processed in the mammalian nervous system. One distinct property of the primary visual cortex is a highly organized pattern of sensitivity to location and orientation of objects in the visual field. But how did we learn this? An important tool is the ability to design experiments to map out the structure and response of a system such as vision. In this activity, students learn about the visual system and then conduct a model experiment to map the visual field response of a Panoptes robot. (In Greek mythology, Argus Panoptes was the "all-seeing" watchman giant with 100 eyes.) A simple activity modification enables a true black box experiment, in which students do not directly observe how the visual system is configured, and must match the input to the output in order to reconstruct the unseen system inside the box.Engineering Connection
Animal vision is a remarkable system that serves as a model for engineers to design machines capable of "seeing." Engineers also apply their understanding of the visual system to design retinal prostheses that are implanted in the eyes of people with damaged photoreceptor cells in order to restore vision by directly stimulating optic nerve cells—an amazing biomedical invention.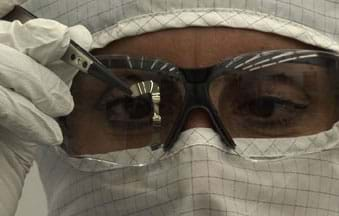
In this activity, students get a taste of the real-world methodology for a model experiment inspired from the neuroscience of vision. The concept of mapping a system's response in a black box setting, in which one indirectly observes a system via its input-output relationship, is universal in science and engineering. Additionally, this lab illustrates the value of processing experimental results in order to reduce large datasets to compact and meaningful summaries.
Learning Objectives
After this activity, students should be able to:
- Describe an overview of the visual pathway of the nervous system.
- Explain what we can learn about the visual system model through the proposed experiment (that is, the spatial concentration of light sensitivity of each sensor [the "receptive field"], and how the sensors are arranged as a group).
- Read a plot of experimental data.
- Interpret experimental data and reduce the data to a more summary graphic.
Educational Standards
Each TeachEngineering lesson or activity is correlated to one or more K-12 science,
technology, engineering or math (STEM) educational standards.
All 100,000+ K-12 STEM standards covered in TeachEngineering are collected, maintained and packaged by the Achievement Standards Network (ASN),
a project of D2L (www.achievementstandards.org).
In the ASN, standards are hierarchically structured: first by source; e.g., by state; within source by type; e.g., science or mathematics;
within type by subtype, then by grade, etc.
Each TeachEngineering lesson or activity is correlated to one or more K-12 science, technology, engineering or math (STEM) educational standards.
All 100,000+ K-12 STEM standards covered in TeachEngineering are collected, maintained and packaged by the Achievement Standards Network (ASN), a project of D2L (www.achievementstandards.org).
In the ASN, standards are hierarchically structured: first by source; e.g., by state; within source by type; e.g., science or mathematics; within type by subtype, then by grade, etc.
NGSS: Next Generation Science Standards - Science
| NGSS Performance Expectation | ||
|---|---|---|
|
HS-LS1-2. Develop and use a model to illustrate the hierarchical organization of interacting systems that provide specific functions within multicellular organisms. (Grades 9 - 12) Do you agree with this alignment? |
||
| Click to view other curriculum aligned to this Performance Expectation | ||
| This activity focuses on the following Three Dimensional Learning aspects of NGSS: | ||
| Science & Engineering Practices | Disciplinary Core Ideas | Crosscutting Concepts |
| Develop and use a model based on evidence to illustrate the relationships between systems or between components of a system. Alignment agreement: | Multicellular organisms have a hierarchical structural organization, in which any one system is made up of numerous parts and is itself a component of the next level. Alignment agreement: | Models (e.g., physical, mathematical, computer models) can be used to simulate systems and interactions—including energy, matter, and information flows—within and between systems at different scales. Alignment agreement: |
| NGSS Performance Expectation | ||
|---|---|---|
|
MS-LS1-8. Gather and synthesize information that sensory receptors respond to stimuli by sending messages to the brain for immediate behavior or storage as memories. (Grades 6 - 8) Do you agree with this alignment? |
||
| Click to view other curriculum aligned to this Performance Expectation | ||
| This activity focuses on the following Three Dimensional Learning aspects of NGSS: | ||
| Science & Engineering Practices | Disciplinary Core Ideas | Crosscutting Concepts |
| Gather, read, and synthesize information from multiple appropriate sources and assess the credibility, accuracy, and possible bias of each publication and methods used, and describe how they are supported or not supported by evidence. Alignment agreement: | Each sense receptor responds to different inputs (electromagnetic, mechanical, chemical), transmitting them as signals that travel along nerve cells to the brain. The signals are then processed in the brain, resulting in immediate behaviors or memories. Alignment agreement: | Cause and effect relationships may be used to predict phenomena in natural systems. Alignment agreement: |
International Technology and Engineering Educators Association - Technology
-
Illustrate that there are multiple approaches to design.
(Grades
3 -
5)
More Details
Do you agree with this alignment?
-
Technological problems must be researched before they can be solved.
(Grades
9 -
12)
More Details
Do you agree with this alignment?
-
Use computers and calculators to access, retrieve, organize, process, maintain, interpret, and evaluate data and information in order to communicate.
(Grades
9 -
12)
More Details
Do you agree with this alignment?
-
Use various approaches to communicate processes and procedures for using, maintaining, and assessing technological products and systems.
(Grades
9 -
12)
More Details
Do you agree with this alignment?
State Standards
New York - Math
-
use various means of representing and organizing observations (e.g., diagrams, tables, charts, graphs, equations, matrices) and insightfully interpret the organized data.
(Grades
9 -
12)
More Details
Do you agree with this alignment?
-
assess correspondence between the predicted result contained in the hypothesis and the actual result and reach a conclusion as to whether or not the explanation on which the prediction was based is supported.
(Grades
9 -
12)
More Details
Do you agree with this alignment?
New York - Science
-
Gather and synthesize information that sensory receptors respond to stimuli, resulting in immediate behavior and/or storage as memories.
(Grades
6 -
8)
More Details
Do you agree with this alignment?
-
Develop and use a model to illustrate the hierarchical organization of interacting systems that provide specific functions within multicellular organisms.
(Grades
9 -
12)
More Details
Do you agree with this alignment?
Materials List
Each group needs:
- writing utensils (pens, pencils, markers), for marking a histogram
- Panoptes and the Bionic Eye Pre-Quiz, one per student
- Panoptes and the Bionic Eye Worksheet, one per student
- Find Your Blind Spot Reading, one per student
- Panoptes and the Bionic Eye Post-Quiz, one per student
To share with the entire class:
- small flashlight (ideally with a lens less than 1 inch across, such as a small LED bulb);costs $10 or less
- Light Mask Stencil
- tape
- piece of cardboard (or other opaque material) on which to tape the stencil, or if performing the black box experiment variation, a cardboard box, such as a shoebox that is big enough to hold the LEGO robot
- something pointy to punch through the stencil into cardboard, making holes; for example, hole sizes up to the diameter of a Bic pen (8 mm) work well
- LEGO MINDSTORMS NXT robot, such as the NXT Base Set (5003402) for $159.98 at https://shop.education.lego.com/legoed/en-US/catalog/product.jsp?productId=5003402& isSimpleSearch=false&ProductLine=NXT
- LEGO MINDSTORMS Education NXT Software 2.1, available as a single license (2000080) for $39.97 or a site license (5003413) for $271.96 at https://shop.education.lego.com/legoed/en-US/catalog/product.jsp?productId=prod120017&isSimpleSearch=false&ProductLine=LEGO+MINDSTORMS+Education+NXT
- computer, loaded with NXT 2.1 software
- 3 additional LEGO NXT Light Sensors for $19.99 each at http://shop.lego.com/en-US/Light-Sensor-9844
- ruler, for constructing the Panoptes assembly and positioning the stencil from the robot
- computer with the Python interpreter (www.python.org) plus supporting packages OR an internet connection to permit data processing through a web interface (www.pythonanywhere.com)
Worksheets and Attachments
Visit [www.teachengineering.org/activities/view/nyu_bioniceye_activity1] to print or download.Pre-Req Knowledge
- Basic interpretation of a function graph—a curve in (x, y) coordinates.
- Bar charts (can be demonstrated in-class).
Introduction/Motivation
(First, administer the pre-quiz, as described in the Assessment section.)
For humans, vision is our most important sense. As a pure sensing mechanism, vision affords us a highly detailed, long-range map of our surroundings. Our reliance on vision is so strong that visual concepts also imbue our conscious minds. If we close our eyes and try to remember something, we typically recall images. Even when we hear a story, much of the language is devoted to depicting imagery. In this activity, we will first learn about the earliest stages of how our brains create vision, and then explore the experimental methods that have been used to discover this knowledge.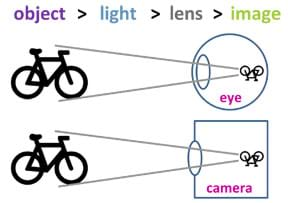
If vision is so important to us, how does it work? As we know, vision begins in our eyes, which are optical sensing organs, meaning they see light. The way an eye sees is roughly analogous to the way a camera sees (Figure 1): a lens assembly (the cornea and the lens of the eye) focuses light onto a photosensitive plane, in this case the retina. The retina contains many photosensitive cells that produce electrical impulses when light hits them. Also, similar to how a camera has a "field of view," we say that our eyes are sensitive only to a certain "visual field." For instance, we cannot see behind us, or even at 180 degrees without moving our eyes and shifting the visual field. Also like the camera, our eyes are not "smart." Eyes alone cannot make sense of the images they see; they just faithfully report those images. In order to really see, we need our brains.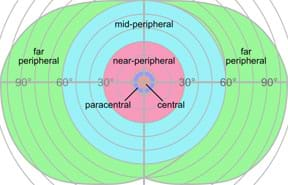
From decades of neuroscience experiments, we know that vision is processed in the brain in (mostly) hierarchical stages called visual pathways. That is, simple features of an image reported by the eye are processed at a primary stage. The information reported by this stage then feeds forward to a next stage that is sensitive to more complex features, and so on.
The first point in our cerebral cortex receiving signals that originate in the eye is called primary visual cortex, or sometimes V1. Researchers know from fairly simple experiments that primary visual cortex is sensitive to location and orientation (Figure 2). Visual field locations and the orientation of objects have very specific representations in the primary visual cortex. In other words, specific areas of the visual cortex correspond to specific regions in the visual field.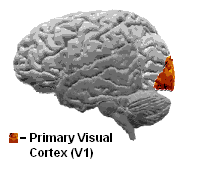
By location sensitivity, we mean that different brain cells (neurons) respond more reliably to light coming from certain locations in the visual field. The pattern of sensitivity is highly organized, such that nearly perfect coordinate transformation exists between the visual field and the anatomical space.
In addition to location, some cells in the primary visual cortex only response reliably to visual patterns taking on a certain orientation. For example, if you take a simple bar image and rotate it slightly, completely different parts of the brain "see" the image.
Combining the location and orientation specificity of V1 neurons, we can use an image filter to model the way objects appear in V1. Such a filter has similar orientation and location preferences. For instance, Figure 3 demonstrates the responses over a field of vertical, diagonal and horizontal preference filters. This represents the aggregate response of V1 neurons with like orientation preference.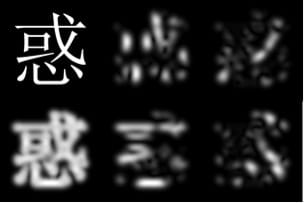
Recently, scientists and engineers have been able to take what we know about the early visual system and develop devices to restore vision in people with certain types of visual deficits. For example, retinitis pigmentosa is a disease of the eye that causes a loss of photoreceptive cells in the retina. Combining the understanding of how retinal images are communicated to the brain and what aspects of the image are important to emphasize, an electronic device was designed to view an image and create electrical signals in place of the missing photoreceptor cells.
So how did researchers find out these facts about our brains? What kind of experiment would lead us to these results? The best experiments are often not very complicated. A simple way to learn the location sensitivity of V1 is to flash very small patches of light one at a time across a range of visual field. At the same time, we track how a number of individual cells respond by measuring the electrical signature of their action potentials and by noting how many times they "fire." If we are careful and keep track of the timing and location of each flash of light, then we can compare the way a cell responds to where the light was flashed.
A good way to quantify a cell's response is by making a histogram of the spike counts. A histogram is a way of splitting a quantity of items across bins, just like an automatic coin sorter groups coins by size. (Refer to Figure 4 for unrelated examples of histograms with bins representing locations.) In this case, the bins represent the different locations of the visual field where we flash light. We assign a neural spike to a bin if that spike can be attributed only to the corresponding flash location. That is, the spike would have had to occur after the corresponding flash location, but before any other flash location. A cell may respond several times for one flash, and the quality of the histogram improves as we repeat the flashing several times to include more and more spikes.
In this activity, we are going to reproduce this visual field mapping experiment on a small scale using Panoptes. The important parts of the experiment we need to consider are:
- (if doing the black box experiment version) we do not know the details of the system inside the box, we can only control the input and observe the output
- creating a regular partition of the visual field of Panoptes
- keeping track of the timing and location of the flashes, that is, using a known sequence
- repeating the sequence of flashes a few times in order to increase the reliability of our observations
The Panoptes robot is programmed to record what it sees, and also record the timings of the flashes. But what constitutes a response? A vital part of the experimental process is to take a preliminary look at the "raw" data, and then decide how to interpret it. The data is a stream of numbers that measure the light intensity. One measure is taken on each sensor about every quarter second. The most common way of looking at the raw data is to plot it as a function of time (a graph). In summary, to map out the visual field of Panoptes, we will analyze the data, look for responses to flashes, and then go back and assign each response to its corresponding flash.
(If doing the black box experiment version.) As a further challenge today, our lab is set up as a black box experiment—the Panoptes robot is hidden inside a box. Who knows what we mean by "black box"? (Listen to student ideas. Then help them with a definition.) It's a common situation in science and engineering in which you must figure out an unknown/unseen system by careful observation of the relationship between its inputs and outputs.) That means that your challenge is to analyze your results to try to conclude how the unseen sensors are configured inside the black box.)
Procedure
Background
Animal vision is a remarkable system capable of processing high bandwidth information streams with high sensitivity to minute detail and the ability to detect very subtle scene changes. In engineering, biological vision often serves as a model for how machines can be programmed to "see" scenes. The hierarchical nature of processing in the neural visual system inspires similar stage-wise processing strategies in computer vision. Image-processing concepts like linear spatial filters have been used successfully to model processing stages of biological vision in the nervous system.
Scientists and engineers also apply their understanding of the visual system to design retinal prostheses that restore function in people with deficits such as retinitis pigmentosa. Implanted in retinas with damaged photoreceptor cells, these biomedical prosthetic devices directly stimulate optic nerve cells. By understanding how the retina communicates with higher visual areas, the stimulation can be patterned in such a way as to provide naturalistic information to the central nervous system.
In this activity, we focus on methodology for a model experiment inspired from the neuroscience of vision. The concept of mapping a system's response in a black box setting, in which one must indirectly observe a system through its input-output relationship, is universal in science and engineering. Additionally, this lab addresses the fact that experimental results require sophisticated processing in order to reduce large datasets to compact and meaningful summaries.
Overview
The purpose of the activity is for students to make a connection between what we know about our vision and the experimental science behind the discovery of these principles. A universal concept in science and engineering is that of a black box system, in which we can only observe the relationship between inputs and responses. The black box framework is used here to be able to reconstruct the inner workings of a light sensing system through a simple experiment of controlled inputs to the system. It is recommended to actually place the Panoptes light sensing system inside a box in order to fully model an experiment.
The activity setup and execution require many steps. Setup is described in the Before the Activity section, and instructions for the in-class component are described in the With the Students sections. Watch the 12-minute Panoptes and the Bionic Eye video on YouTube for an overview of the equipment setup, data collection and analysis steps involved in the activity: https://www.youtube.com/watch?v=iT0P4wj1RRo&feature=youtu.be.
Before the Activity
- Gather materials and make copies of the Panoptes and the Bionic Eye Pre-Quiz, Panoptes and the Bionic Eye Worksheet (which includes a blank histogram template), Find Your Blind Spot Reading and Panoptes and the Bionic Eye Post-Quiz, one each per student. Consider replacing the reading with on online version of the information and exercise; see a recommended website in the Additional Multimedia Support section.
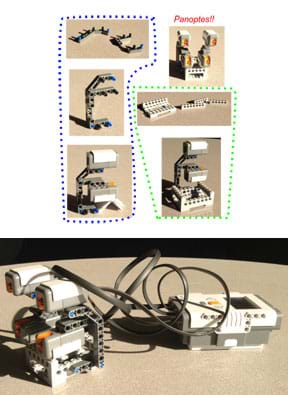
- Prepare the Panoptes light sensing system by constructing the NXT module with four light sensors arranged as shown in Figure 5 and the Panoptes Construction Visual Aid (a larger image of Figure 5). The creation is named after Argus Panoptes of Greek mythology, with four "eyes" instead of 100! It helps to secure the base of the Panoptes robot so that the assembly does not move during the experiment.
- Download the Light Log Program (rbt file) onto the NXT using the MINDSTORMS software. This NXT program continuously records light intensity to a file named "light_log.txt" and also records button press events to a file named "timestamp.txt."

Figure 6. Open the NXT browser by clicking this button in the MINDSTORMS software application. - Review how to retrieve data files from the NXT.
- Find the NXT browser menu by clicking on the NXT button in the MINDSTORMS control panel (shown in Figure 6).
- After opening the NXT window, click on the "Memory" tab.
- Click on the "Other" category on the left side.
- One at a time, choose "light_log.txt" and "timestamp.txt" and upload them to your computer.

Figure 7. An example of the black box modification, with the light mask punched through one side of a box, and the light sensors secured inside the box.
- Print out the Light Mask Stencil and tape the template onto a piece of cardboard (or other opaque material) and punching through the marked holes. As an added challenge and variation on the activity, set it up as a black box experiment by positioning and securing Panoptes inside a cardboard box. To do this, tape the stencil template on one side of the box and punch the holes through to the inside of the box, looking in towards the light sensors (see Figure 7). Also cut a hole in the side of the box through which to route the sensor cables.
- Prepare the software needed to run the attached script to process data collected in the classroom on Day 1. Then, before starting Day 2, use the data processing script to print out four graph traces of each group's data (one for each light sensor) to hand out to groups for data analysis. See examples in Figure 8-top. Refer to the Plotting Python file ("plotting.py") for details regarding the operation of the script. Two alternatives are possible for running the script:
- Python 2.6 or 2.7 interpreter with "numpy" and "matplotlib" packages installed. This collection of open source scientific software tools may be available in some classrooms or installed as part of a larger bundled package that is freely available for academic use. See https://www.enthought.com/products/canopy/academic/ for more details.
- The Python Anywhere web interface can run the attached processing script with no need for software installation. Refer to the Python Anywhere Instructions for help with this alternative.
With the Students: Day 1
- Once students have been introduced to the activity, explain how the LEGO NXT setup is a model of a visual system that can produce data similar to that produced in real-world visual field mapping experiments. This "Panoptes light sensing system" is named after Argus Panoptes of Greek mythology, the watchman giant with 100 eyes.
- Divide the class into groups of four students each.
- Hand out the reading sheet, which describes how to find one's retinal blind spots. Use the reading and exercise as a side activity to fill the down time while groups are taking turns performing the main experiment. Also use this activity to provoke discussion about why we do not usually notice our blind spots. How are we are able to perceive a continuous visual field despite such a blind spot?
- While some students work on the reading assignment, have one group at a time use the NXT module to gather data by the process described on the worksheet. In order to gather data, students to do the following:
- Hold the light stencil 10-15 cm (4-6 inches) away from the light sensors, so that the light sensors face the front of the stencil. (Results will vary depending on the hole size and light source type used.) If Panoptes is inside the box, then use these same guidelines to fix its position relative to the light holes before closing the box.
- Have one student hold the flashlight to the back of the stencil and shine the light briefly (for less than 1 second) through each hole in the stencil, sliding along the template, following the numbered sequence.
- Have a second group member press the right arrow button on the NXT simultaneously with each flash of light through the stencil. Have this experimenter attempt to mark the time just before a location is flashed. It helps if the student shining the light counts out loud as s/he progresses through the numbered sequence of holes so the second student can match button pushes to light flashes.
- Direct students to repeat this procedure for a total of three or more trials. Inform students that due to the NXT's memory limit and the fact that all trials must be recorded in one session, a rather short recording window exists. Thus, encourage groups to make their passes through the grid quickly and accurately, while still flashing each location for about 1 second. Conversely, enough classroom time is provided to permit groups to restart any problematic sessions so that they only record "clean data," which works best.
- Once all students have completed gathering data and finding their blind spots, lead a brief class discussion about why researchers consider it important to conduct multiple data trials.
- Stick to illuminating the first-order description of observations, that is, the average.
- In the Panoptes scenario, we are modeling what is basically a "binary" outcome: either a cell has fired an action potential or not. In the model case, either the sensor's recording is above the threshold or not.
- Example: If we were trying to quantify how good a particular baseball player is at hitting, it would be unreliable to watch her swing at just one pitch. Then she is either good or not, and furthermore we would get very different answers looking at different events. Instead, looking at a batting average is more robust and more sensitive to differences between players.
- Likewise, by observing multiple independent passes of binary outcomes in our experiment, we can find a more reliable average response and see a variation of responses between conditions.
- Show students the raw data output from the NXT module, which is in the form of arrays of numbers. What observations and conclusions can they make by looking at the data? Through discussion, expect students to come to the realization that this data is difficult to interpret and use in its raw state, and that it would be helpful if it could be transformed into a more useful representation using mathematical tools.
- Direct students to work in their groups to think of mathematical tools that might help produce more useful representations of the data. Assign this as homework due at the start of Day 2.
With the Students: Day 2
- Have students assemble into the same groups as on Day 1.
- Present the groups with graph traces of their data (such as Figure 8-top). Lead a class discussion to review how to interpret graphs, giving attention to what is represented on each axis, what the spikes in the graph mean, and how information can be gained from the graphs. Use an example, such as a graph from one of the groups or the Figure 8 example graph.
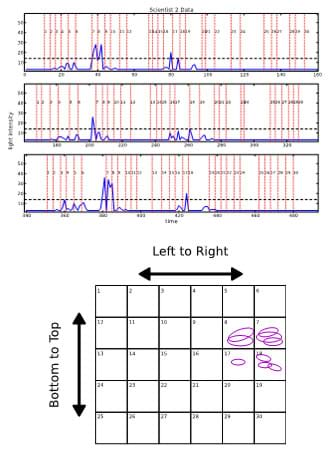
Figure 8. Looking at these example graph traces of data, the peaks of the light-intensity recording are classified by the corresponding light-hole number, and accumulated in a graphical histogram. The result shows a concentration of light response in the upper-right hand set of light-holes. - A particular threshold is computed in the data processing script. This threshold is based on the statistics of the entire data set, with the assumption that "true" activation responses are rare, large amplitude events in the midst of ubiquitous, small amplitude background noise. In other words, when amplitude is high enough that any response past this point is too improbable to be considered part of the background. Address the presence of the threshold as part of the information in the graph. The instructor can choose to ask groups to determine their own thresholds.
- Are the assumptions valid for the data at hand?
- Is the threshold "good"? For example, the graphs in Figure 8 have a very low level background and the threshold could be considered too high. It is certainly possible to distinguish a response just by eye.
- What would be the effect of raising or lowering the threshold? (Answer: Lowering would pass a higher number of activation responses, with the possible result of introducing noise—false positives. Raising might reject true activations—false negatives—and similarly distort the image of a sensor's receptive field.)
- Do we need a threshold at all? Can we just look at each flash response on a case-by-case basis? (The answer in this case is no, of course.)
- Give each of the four students in each group a graph for one of the four light sensors, as produced by the data processing script, along with a blank histogram grid (last page of worksheet). Direct students to count peaks above the threshold and mark the corresponding numbered histogram bins with circles. If desired, students may encode the relative height of the super-threshold peaks by drawing larger or smaller circles.
- Once all students in a group have completed their individual histograms, ask the group to determine which histogram corresponds to each of the four light sensors. If doing the black box experiment version, remind students that they need to analyze their results to try to conclude how the unseen sensors are configured inside the black box.
- Lead a class debriefing discussion as described in the Assessment section.
- Conclude by administering the post-quiz, as described in the Assessment section.
Vocabulary/Definitions
action potential: A brief burst of electrical potential across a neuron's membrane that communicates electrical changes to other cells. The AP is often referred to as firing or spiking.
black box system: A framework for describing an unobservable but potentially complex system that transforms inputs into responses. We cannot directly measure the action of the transformation, but we can characterize much of the action by experimentally controlling the input. This is formally equal to the dependent/independent variable description of experimental observation.
cerebral cortex: The outermost layer of the brain, which is responsible for high-level sensory processing and integration (among many other roles).
histogram: A graphical representation of quantities in different categories.
neuron: The primary cell of the central nervous system.
primary visual cortex: The first area in the visual cortex to receive visual information from the eye. The area is also called V1.
receptive field: A sub-region of the visual field that causes a reliable response from a given part of the visual pathway.
retina: The photo-sensitive region of the eye.
visual cortex: The area of the brain that is responsible for processing visual data.
visual field: The extent of the observable world seen at any given moment. Also called field of view or field of vision.
visual pathway: The anatomical route that visual information takes from the eye through the central nervous system.
Assessment
Pre-Activity Assessment
Pre-Quiz: Administer the six-question Panoptes and the Bionic Eye Pre-Quiz, which surveys students' knowledge of vision and graphing, and general level of interest in science and engineering. Students will learn the answers to questions 1-4 during the course of the activity. Review their answers to gauge their base level understanding of the subject matter.
Activity Embedded Assessment
Worksheet: Have students use the Panoptes and the Bionic Eye Worksheet as they work through the activity; it aids them with vocabulary, visualizing the experiment and practice making histograms. The last worksheet page provides a grid on which they can plot their final histograms for their data sets. Review their final histograms to verify their comprehension of the activity concepts.
Post-Activity Assessment
Class Discussion: During the concluding class debriefing discussion, assess students' understanding of the experimental results and conclusions as they share and compare results. Expect groups to be able to determine that the four light sensors account for responses coming from four quadrants in the visual field, and thus must be arranged in a square grid configuration. Then explore what students' results mean for neuroscience and inventions like the bionic eye/retinal prostheses, as well as the value in using different means of representing data.
Post-Quiz: Administer the 10-question Panoptes and the Bionic Eye Post-Quiz, which includes in-depth questions on the topics of the visual cortex and the role of graphical representations of data. Review students' answers to individually gauge their depth of comprehension of the activity subject matter.
Safety Issues
Do not substitute the flashlight with a laser pointer. Laser pointers are unable to provide usable data for the activity and introduce the risk of eye damage.
Troubleshooting Tips
It is important that the correct timing of each flash condition is recorded through button-pressing. If the number of recorded time stamps does not match the number of expected time stamps, the processing script will warn you of that and stop the plotting from going forward for that dataset.
Activity Extensions
As a fun alternative to the Find Your Blind Spot Reading, have students find and experiment with their retinal blind spots at Visionary Eyecare's Blog: "The Eye Journal" website at: http://visionaryeyecare.wordpress.com/2008/08/04/eye-test-find-your-blind-spot-in-each-eye/.
Activity Scaling
For lower grades:
- Have students work in larger groups or offer more assistance to each group.
- Present the activity with a more in-depth introduction and explanation. Carefully review the vocabulary words and key concepts before beginning the activity.
For upper grades:
- Require groups to compute the mean, max, min, mode and standard deviation of the data.
- Have students record the data as binary data for the Panoptes scenario (0 = light not detected, 1 = light detected). This also serves as an introduction to binary numbers and the base 10-system.
Additional Multimedia Support
To help students understand that visual field locations and the orientations of objects map to specific brain areas, show them Figure 4 and Figure 6 in the Visual Prosthesis paper by Peter H. Schiller and Edward J. Tehovnik in Perception. 2008; 37 (10), pp 1529-59.
For a series of 3D line histograms showing an example of data binning of V1 cell responses according to flash location in the visual field, see the following visual neuroscience paper: J. P. Jones and L. A. Palmer, "An evaluation of the two-dimensional Gabor filter model of simple receptive fields in cat striate cortex," Journal of Neurophysiology, American Physiological Society; December 1, 1987; 58 (6), pp. 1233-1258 at https://jn.physiology.org/content/58/6/1233 (available to view on a per use basis for a modest fee).
Read about an artificial retina project (includes photo of the device and diagram of how it works) in Lawrence Livermore National Lab's newsletter at https://www.llnl.gov/news/newsreleases/2010/NR-10-09-06.html.
Learn about examples of retinal prostheses/bionic eye implants under development at: Second Sight at http://2-sight.eu/en/home-en and Bionic Vision Australia at http://bionicvision.org.au/.
Subscribe
Get the inside scoop on all things Teach Engineering such as new site features, curriculum updates, video releases, and more by signing up for our newsletter!More Curriculum Like This

Students learn about the function and components of the human nervous system, which helps them understand the purpose of our brains, spinal cords, nerves and five senses. In addition, how the nervous system is affected during spaceflight is also discussed.

Students are introduced to the Robotics Peripheral Vision Grand Challenge question. They are asked to write journal responses to the question and brainstorm what information they require in order to answer the question. Students draw a basis for the average peripheral vision of humans and then compa...
Copyright
© 2013 by Regents of the University of Colorado; original © 2013 Polytechnic Institute of New York UniversityContributors
Michael Trumpis, Shingi Middelmann, Gisselle CunninghamSupporting Program
AMPS GK-12 Program, Polytechnic Institute of New York UniversityAcknowledgements
This activity was developed by the Applying Mechatronics to Promote Science (AMPS) Program funded by National Science Foundation GK-12 grant no. 0741714. However, these contents do not necessarily represent the policies of the NSF, and you should not assume endorsement by the federal government.
Additional support was provided by the Central Brooklyn STEM Initiative (CBSI), funded by six philanthropic organizations.
Last modified: January 17, 2018


User Comments & Tips