Quick Look
Grade Level: 11 (11-12)
Time Required: 1 hour
Expendable Cost/Group: US $0.00 This activity uses some non-expendable (reusable) items (accelerometers or smartphones); see the Materials List for details.
Group Size: 3
Activity Dependency: None
Subject Areas: Data Analysis and Probability, Problem Solving

Summary
Gait analysis is the study of human motion that can be utilized as biometric information or identification, for medical diagnostics or for comparative biomechanics. In this activity, students observe walking human subjects and then discuss parameters that could be used to characterize walking gaits. They use accelerometers to collect and graph acceleration vs. time data that can help in gait analysis—all part of practicing the engineering data analysis process. Students complete this activity before learning the material presented in the associated lesson.Engineering Connection
Gait analysis is the systematic study of human motion, using visual observations and movement measurements. The technology to analyze gait patterns has advanced dramatically in the past few decades. Researchers now have a better understanding of the process of human locomotion and how individual testing and gait analysis can assist in diagnosis and treatment of some medical conditions. Biotechnology researchers continue to create and evolve the techniques to capture data easily and accurately, and then interpret it through engineering analysis, with the intent that the process becomes more routine and helpful.
Learning Objectives
After this activity, students should be able to:
- Analyze data.
- Define characteristics relating to data.
Educational Standards
Each TeachEngineering lesson or activity is correlated to one or more K-12 science,
technology, engineering or math (STEM) educational standards.
All 100,000+ K-12 STEM standards covered in TeachEngineering are collected, maintained and packaged by the Achievement Standards Network (ASN),
a project of D2L (www.achievementstandards.org).
In the ASN, standards are hierarchically structured: first by source; e.g., by state; within source by type; e.g., science or mathematics;
within type by subtype, then by grade, etc.
Each TeachEngineering lesson or activity is correlated to one or more K-12 science, technology, engineering or math (STEM) educational standards.
All 100,000+ K-12 STEM standards covered in TeachEngineering are collected, maintained and packaged by the Achievement Standards Network (ASN), a project of D2L (www.achievementstandards.org).
In the ASN, standards are hierarchically structured: first by source; e.g., by state; within source by type; e.g., science or mathematics; within type by subtype, then by grade, etc.
NGSS: Next Generation Science Standards - Science
-
Ask questions that arise from examining models or a theory to clarify relationships.
(Grades 9 - 12)
More Details
Do you agree with this alignment?
Common Core State Standards - Math
-
Summarize, represent, and interpret data on a single count or measurement variable
(Grades
9 -
12)
More Details
Do you agree with this alignment?
-
Represent data on two quantitative variables on a scatter plot, and describe how the variables are related.
(Grades
9 -
12)
More Details
Do you agree with this alignment?
-
Reason quantitatively and use units to solve problems.
(Grades
9 -
12)
More Details
Do you agree with this alignment?
International Technology and Engineering Educators Association - Technology
-
Illustrate principles, elements, and factors of design.
(Grades
9 -
12)
More Details
Do you agree with this alignment?
-
Optimize a design by addressing desired qualities within criteria and constraints.
(Grades
9 -
12)
More Details
Do you agree with this alignment?
State Standards
Hawaii - Math
-
Summarize, represent, and interpret data on a single count or measurement variable
(Grades
9 -
12)
More Details
Do you agree with this alignment?
-
Represent data on two quantitative variables on a scatter plot, and describe how the variables are related.
(Grades
9 -
12)
More Details
Do you agree with this alignment?
Nevada - Technology
-
Process data and report results.
(Grades
K -
12)
More Details
Do you agree with this alignment?
-
Collect and analyze data to identify solutions and/or make informed decisions.
(Grades
K -
12)
More Details
Do you agree with this alignment?
New Mexico - Math
-
Reason quantitatively and use units to solve problems.
(Grades
9 -
12)
More Details
Do you agree with this alignment?
-
Summarize, represent, and interpret data on a single count or measurement variable
(Grades
9 -
12)
More Details
Do you agree with this alignment?
-
Represent data on two quantitative variables on a scatter plot, and describe how the variables are related.
(Grades
9 -
12)
More Details
Do you agree with this alignment?
Materials List
Each group needs:
- accelerometer, see below for suggested Vernier and smartphone app options
- belt, strap, or some way to attach accelerometer to a person's lower back
- computer with Microsoft Excel®, or similar program
- (optional) capability to video record the human subject gaits; such as with a cell phone.
- Identifying Gait Metrics Activity Assessment, one per student
To share with the entire class:
- several students and/or adults of different physical characteristics to serve as human subjects; find persons that are tall, short, heavy, light, men, women, older, younger, etc.
- (optional) Four Questions Visual Aid
The author used Vernier's internal 3-axis accelerometer of the LabQuest 2, available for $329. Vernier also has a 1-axis accelerometer for $89 and a 3-axis accelerometer for $99. For data collection, those sensors require an interface to connect to a computer and Logger Lite software, which can be downloaded for free. The 1-axis accelerometer is compatible with Vernier's Go!Link interface for $61. The least-expensive interface option for the 3-axis accelerometer is the LabQuest Mini for $149, but it will also work with a LabQuest. Below are links to the mentioned products:
- LabQuest 2 at https://www.vernier.com/products/interfaces/labq2/
- Low-g accelerometer (1-axis) at https://www.vernier.com/products/sensors/accelerometers/lga-bta/
- 3-axis accelerometer at https://www.vernier.com/products/sensors/accelerometers/3d-bta/
- Logger Lite at https://www.vernier.com/products/software/logger-lite/
- Go!Link at https://www.vernier.com/products/interfaces/go-link/
As another alternative, have students download an app to access data from the internal accelerometer of a smartphone (or tablet or other device). Many free or low-cost accelerometer apps are available through Google Play for Android devices. For example, the "Physics Toolbox Accelerometer" by Vieyra Software was successfully tested and data was collected and transferred to a computer.
Worksheets and Attachments
Visit [www.teachengineering.org/activities/view/uno_walk_lesson01_activity1] to print or download.Introduction/Motivation
Have you ever thought about the way you walk and run? Or noticed that the people you know have a distinct way of walking? Can you recognize certain people by how they walk? What is noticeable about how those people move? Could you collect data on this and learn from it?
Some engineers study the way people walk! Gait analysis is the systematic study of human motion, using visual observations and movement measurements for the purpose of helping people with conditions affecting their ability to walk, such as helping athletes move more efficiently and identifying posture- or movement-related problems in people with injuries. Gait analysis is important for some medical diagnostics and the area of biomechanics, so engineers design ways to test, analyze and learn from the way people walk.
What I have just described is a good example of what we call engineering analysis—the application of scientific and analytic principles to reveal the state and properties of a system. Doing this helps engineers begin to understand how and why systems behave the way they do. For the gait analysis lesson we are beginning today, you will perform engineering analysis on the gait data from several human subjects to understand what properties of a walking gait could be utilized to identify different types of people and what possible measures related to the human gait could be utilized to quantify that gait.
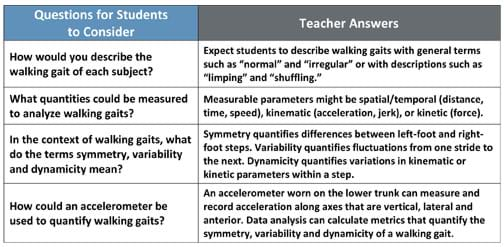
In today's activity, several human subjects of different physical characteristics will walk across the room. The reason for the diversity is that walking gait characteristics can vary between subjects based on factors such as age, health and physical activity. As you observe the individuals' different gaits, keep the following four questions in mind and attempt to pose answers. (Refer to Table 1; read the questions aloud, write them on the classroom board, or show the class the Four Questions Visual Aid.) After observations are made, you will answer the questions as a class before attempting to collect numeric data that may be utilized to quantify a person's gait. 
Procedure
Teacher Note
In the activity, the data collection procedure can be completed using a Vernier LabQuest 2, which has an internal accelerometer, or by using various smartphones, tablets and other devices that have internal accelerometers along with their particular interfaces/software systems/apps to record movement measurements (some of which also create graphs; see suggestions in the Materials List). Once acceleration data is collected, students can transfer the data to Microsoft Excel® (or a similar software application) to create acceleration vs. time graphs.
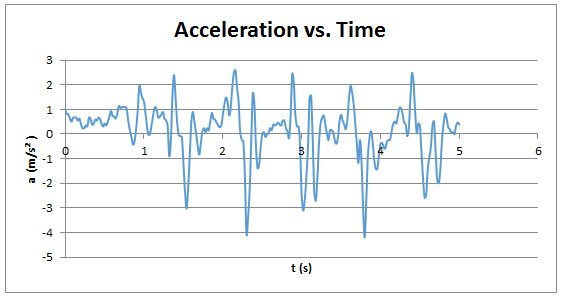
With the internal accelerometer enabled, the LabQuest 2 collects data and generates acceleration vs. time graphs. Even though the LabQuest2 is very cost-effective and many schools have them, we found that the graphs generated by the LabQuest 2 are not detailed enough for analysis of the specific gait metrics, such as the characteristics of each step. Much more expensive devices exist that would produce the needed data, but most schools are not going to purchase them or have access to them. Thus, it is recommended to have students collect data using the LabQuest2 (or other devices), just as scientists and engineers would, and then have them create "clean" graphs for analysis purposes by transferring the collected data to Microsoft Excel® to generate the graphs. Figure 1 shows an example acceleration vs. time graph produced in Excel®. The experience of data collection and examining fuzzy data is an important exercise in itself. Obtaining clean data permits further analysis of the gait information, which is a tangible, real-world application that students perform after the activity, as guided by the associated lesson.
Before the Activity
- Arrange for several students and/or teachers of different physical characteristics to serve as human subjects.
- Test the accelerometers and their data gathering interfaces—to minimize technology glitches during the activity.
- Make copies of the Identifying Gait Metrics Activity Assessment, one per student.
- (optional) Prepare to use the Four Questions Visual Aid as an overhead projector transparency or handout, if desired.
- (optional) Have ready video cameras or cell phones to record the human subject gaits.
With the Students
- Ask the class the warm-up questions provided in the Assessment section.
- Present the Introduction/Motivation content.
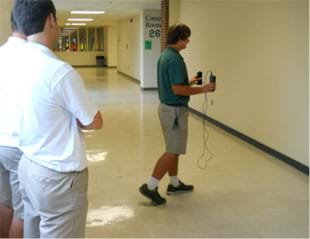
- Have the pre-selected human subjects of different physical characteristics walk across the room for students to observe. Have each subject walk differently so as to provide different gait characteristics. For example, walk slowly, walk with long strides or walk ploddingly, etc. Direct the subjects to walk forward with the same gait for the duration of the observation time.
- Remind students of the four questions posed during the Introduction/Motivation discussion. Lead a class discussion that includes students sharing their answers to the questions. If the class is stuck, help them reach some of the example answers provided in Table 1.
- Next, group students in teams of three. Provide each team with an accelerometer to use to collect acceleration data. Tell students that from the movement data they collect they will create acceleration vs. time graphs that can be used to analyze walking gaits.
- Have each group select one team member to be the human subject. Have groups attach an accelerometer to the lower back of the human subject using a belt or strap, oriented with its axis horizontal and parallel to the direction being walked. Set the accelerometer to interpret the direction from the subject toward the wall as the positive direction and collect data with a sample rate of at least 20 Hz..
- (Optional) At this time, have another student in the group capture video of the subjects walking in order to later compare their movements to the acceleration vs. time data collected. Make sure to orient the accelerometer with its axis horizontal and parallel to the direction the person will be walking.
- Have each group collect acceleration vs. time data using the accelerometer while its human subject walks forward. (optional) Have another teammate video the subject walking so that the team can later compare it to the data collected. Collect the data with a sample rate of at least 20 Hz and have students set the accelerometer to interpret the direction from the subject toward the wall as the positive direction.
- After groups have collected their acceleration data, have them use the data to generate acceleration vs. time graphs.
- As a class, look at the (videos and) graphs and discuss features of the graphs that could be used to identify each stride, step or step phase. Ask the analysis questions provided in the Assessment section.
- Next, have students calculate parameters such as step time or peak acceleration in their group's graph to quantify characteristics of each stride, step or step phase. Ultimately, these characteristics can be used to design metrics to quantify symmetry, variability and dynamicity for the walking gait.
- Administer the post-activity writing assessment, as described in the Assessment section. Review their answers through a class discussion. Then move on to present to students the material in the associated lesson.
Vocabulary/Definitions
accelerometer: A device that measures the physical acceleration experienced by an object.
dynamicity: In terms of gait analysis, the quantification of variations in kinematic or kinetic parameters within a step.
gait: The stride of a human as s/he moves his/her limbs.
metric: A quantitative indicator of a characteristic or attribute.
symmetry: In terms of gait analysis, the quantification of differences between left-foot and right-foot steps.
variability: In terms of gait analysis, the quantification of fluctuations from one stride to the next.
Assessment
Pre-Activity Assessment
Warm-Up: Before beginning the activity, ask the students:
- What is a gait?
- When looking at people walk, what differences do you see?
- How might differences in gaits help you identify people?
Activity Embedded Assessment
Analysis Questions: As students are engaged in the activity, ask the following or similar questions:
- Can you identify characteristics of a gait that help to identify differences in gaits?
- Can you correlate the acceleration vs. time graph with the video of its representative gait?
- Can you locate parameters and design metrics that could be used to model a gait?
Post-Activity Assessment
Writing Prompts: At lesson end, administer the Identifying Gait Metrics Activity Assessment, which asks students to individually answer two writing prompts. When students are done, lead a class discussion to review their answers. Refer to the Identifying Gait Metrics Activity Assessment Answer Key. Students' answers reveal their depth of comprehension.
Subscribe
Get the inside scoop on all things Teach Engineering such as new site features, curriculum updates, video releases, and more by signing up for our newsletter!More Curriculum Like This

After students have complete the associated activity to collect and graph acceleration data from walking human subjects, they learn more about gait analysis---the study of human motion, which is used as biometric data for human medical diagnostics and (non-human) comparative biomechanics.

Students prepare for the associated activity in which they investigate acceleration by collecting acceleration vs. time data using the accelerometer of a sliding Android device. Based on the experimental set-up for the activity, students form hypotheses about the acceleration of the device. Students...

Students observe four different classroom setups with objects in motion (using toy cars, a ball on an incline, and a dynamics cart). At the first observation of each scenario, students sketch predicted position vs. time and velocity vs. time graphs.
References
Simon, Sheldon R., "Quantification of human motion: gait analysis-benefits and limitations to its application to clinical problems." Journal of Biomechanics, published online August 19, 2004; 37(12):1869-80. http://www.jbiomech.com/article/S0021-9290(04)00122-8/abstract
Copyright
© 2015 by Regents of the University of Colorado; original © 2014 Board of Regents, University of NebraskaContributors
Jeremy Scheffler, Brian SandallSupporting Program
IMPART RET Program, College of Information Science & Technology, University of Nebraska OmahaAcknowledgements
The contents of this digital library curriculum were developed as a part of the RET in Engineering and Computer Science Site on Infusing Mobile Platform Applied Research into Teaching (IMPART) Program at the University of Nebraska Omaha under National Science Foundation RET grant number CNS 1201136. However, these contents do not necessarily represent the policies of the National Science Foundation, and you should not assume endorsement by the federal government.
Last modified: August 8, 2025


User Comments & Tips