Quick Look
Grade Level: 11 (9-12)
Time Required: 3 hours 15 minutes
(can be split into four 50-minute sessions)
Expendable Cost/Group: US $0.50 This activity also requires some non-expendable lab supplies and equipment that are all reusable if properly stored after the activity; see the Materials List for details.
Group Size: 4
Activity Dependency: None
Subject Areas: Physics
NGSS Performance Expectations:

| HS-PS4-1 |
Summary
Students determine the refractive index of a liquid with a simple technique using a semi-circular hollow block. Then they predict the refractive index of a material (a Pyrex glass tube) by matching it with the known refractive index of a liquid using the percent light transmission measurement. The homemade light intensity detector uses an LED and multimeter, which are relatively inexpensive (and readily available) compared to commercially available measurement instruments.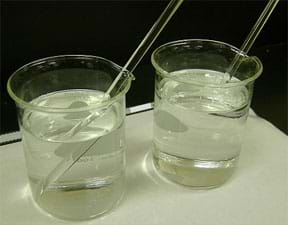
Engineering Connection
Refractive index is a fundamental optical property of materials, and knowing the accurate value of a material's refractive index enables us to predict the angle that light is bent as it passes through the material, which is important in many real-world applications. Chemical, environmental and biomedical engineers take advantage of refractive index matching to minimize (if not remove) multiple scattering when capturing images to study the properties and behavior of micro- and nano-sized particles (such as bacterial and colloidal systems). Optical engineers use accurate measurements of refractive index to design optical instrument components such as lenses, microscopes, telescopes as well as other equipment that utilize the properties of light. Mechanical engineers must know the refractive index of fluids and other materials to build efficient and affordable machines. These examples illustrate the importance of knowing and understanding the concept of refractive index. Numerous methods and modern instruments are available to accurately measure the refractive index of various materials.
Learning Objectives
After this activity, students should be able to:
- Determine the relationship of the angle of incidence and the angle of refraction between two different media.
- Measure the refractive index of a given liquid using Snell's law.
- Determine the refractive index of an unknown material using percent light transmission.
Educational Standards
Each TeachEngineering lesson or activity is correlated to one or more K-12 science,
technology, engineering or math (STEM) educational standards.
All 100,000+ K-12 STEM standards covered in TeachEngineering are collected, maintained and packaged by the Achievement Standards Network (ASN),
a project of D2L (www.achievementstandards.org).
In the ASN, standards are hierarchically structured: first by source; e.g., by state; within source by type; e.g., science or mathematics;
within type by subtype, then by grade, etc.
Each TeachEngineering lesson or activity is correlated to one or more K-12 science, technology, engineering or math (STEM) educational standards.
All 100,000+ K-12 STEM standards covered in TeachEngineering are collected, maintained and packaged by the Achievement Standards Network (ASN), a project of D2L (www.achievementstandards.org).
In the ASN, standards are hierarchically structured: first by source; e.g., by state; within source by type; e.g., science or mathematics; within type by subtype, then by grade, etc.
NGSS: Next Generation Science Standards - Science
| NGSS Performance Expectation | ||
|---|---|---|
|
HS-PS4-1. Use mathematical representations to support a claim regarding relationships among the frequency, wavelength, and speed of waves traveling in various media. (Grades 9 - 12) Do you agree with this alignment? |
||
| Click to view other curriculum aligned to this Performance Expectation | ||
| This activity focuses on the following Three Dimensional Learning aspects of NGSS: | ||
| Science & Engineering Practices | Disciplinary Core Ideas | Crosscutting Concepts |
| Use mathematical representations of phenomena or design solutions to describe and/or support claims and/or explanations. Alignment agreement: | The wavelength and frequency of a wave are related to one another by the speed of travel of the wave, which depends on the type of wave and the medium through which it is passing. Alignment agreement: | Empirical evidence is required to differentiate between cause and correlation and make claims about specific causes and effects. Alignment agreement: |
Common Core State Standards - Math
-
Graph linear and quadratic functions and show intercepts, maxima, and minima.
(Grades
9 -
12)
More Details
Do you agree with this alignment?
-
Interpret the parameters in a linear or exponential function in terms of a context.
(Grades
9 -
12)
More Details
Do you agree with this alignment?
-
Solve linear equations and inequalities in one variable, including equations with coefficients represented by letters.
(Grades
9 -
12)
More Details
Do you agree with this alignment?
International Technology and Engineering Educators Association - Technology
-
Assess how similarities and differences among scientific, mathematical, engineering, and technological knowledge and skills contributed to the design of a product or system.
(Grades
9 -
12)
More Details
Do you agree with this alignment?
-
Connect technological progress to the advancement of other areas of knowledge and vice versa.
(Grades
9 -
12)
More Details
Do you agree with this alignment?
-
Synthesize data and analyze trends to make decisions about technological products, systems, or processes.
(Grades
9 -
12)
More Details
Do you agree with this alignment?
State Standards
Texas - Science
-
research and describe the connections between physics and future careers; and
(Grades
9 -
12)
More Details
Do you agree with this alignment?
-
investigate behaviors of waves, including reflection, refraction, diffraction, interference, resonance, and the Doppler effect;
(Grades
9 -
12)
More Details
Do you agree with this alignment?
-
organize, analyze, evaluate, build models, make inferences, and predict trends from data;
(Grades
10 -
12)
More Details
Do you agree with this alignment?
Materials List
For the teacher-led class demonstration:
- Disappearing Glass Demo Instructions
- two 500-ml clear glass beakers
- glycerin (or vegetable oil, such as Wesson; glycerin is preferred; see note below)
- water
- 2 Pyrex stirring rods, such as the 12-inch clear glass stir rod available for $1.75 each at The Science Company website at https://www.sciencecompany.com/Clear-Glass-Stir-Rod-12-inch-P17256.aspx
Each group needs:
- poster board and writing utensils (or a small white board and a dry erase marker)
- Refractive Index Lab Worksheet
- (optional, for activity extension assignment) Refractive Index Application Research Questions
For Part 1, each group needs:
- laser pointer
- print out of a polar graph; such as the example graphs found at the University of South Florida's Florida Center for Instructional Technology ClipArtETC website at http://etc.usf.edu/clipart/43000/43018/polar_24-4l_43018.htm
- (optional but recommended) plastic sheet protector to protect the paper polar graph from spills
- clear tape
- semicircular hollow acrylic block, 12 cm diameter x 2.5 cm high, available (part# RCSC01) at Nova-Tech International at http://www.novatech-usa.com/RCSC01
- ~50 ml water
- ~50 ml glycerin (or vegetable oil, such as Wesson), such as ACS grade, 4-liter bottle of glycerin (catalog # S25342D) from Fischer at https://www.fishersci.com/shop/products/glycerin-4l-acs-grade/s25342d; glycerin is preferred because it is the same color as water so students will not realize at first that the two liquids are different, and it is soluble in water, making clean-up easier
For Part 2, each group needs:
- laser pointer
- LED lights/semiconductors (matching the color of the laser used), such as the LED semiconductors from Sargent Welch for a pack of five at https://sargentwelch.com/store/product/8887114/led-semiconductors
- 4 containers (cuvettes are preferred, but small test tubes also work)
- ~6 ml water
- ~6 ml glycerin (or vegetable oil, such as Wesson)
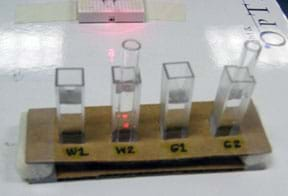
- 2 Pyrex glass tubes (~6 cm in length each) that fit in the sample container, as shown in Figure 2; such as "Rod, glass, Pyrex, 3 mm OD (outer diameter)," catalog # 239430, page 193 in University of Houston's Research Stores 2013 Catalog, for ~$1 per piece (~1.5 meter) at http://researchstores.nsm.uh.edu/catalog, Pyrex brand is necessary to get the desired results
- sample container rack or holder to securely hold vials of four samples, such as the one shown in Figure 2 made with cardboard, clear tape and two packing foam pieces
- multimeter
- electronic breadboard and electrical wire (optional but recommended to ensure the stability of the detector), such as the five mini solderless prototype breadboards with 170 tiepoints available for $6.67 at http://www.ebay.com/itm/5x-Transparent-Mini-Solderless-Prototype-Breadboard-170-Tie-points-for-Arduino-/231242048856?pt=LH_DefaultDomain_0&hash=item35d719a558 or www.amazon.com.
To share with the entire class:
- (optional but recommended if available) lux meter, to verify the reliability of the results from the homemade LED-multimeter light intensity detector; such as Mastech's light meter LX1010B, 50,000 Lux Luxmeter with LCD display for $15 (MSRP $50) at https://www.amazon.com/Light-Meter-LX1010B-Luxmeter-display/dp/B000JWUT6O
Worksheets and Attachments
Visit [www.teachengineering.org/activities/view/uoh_invisible_activity1] to print or download.Pre-Req Knowledge
Student are expected to know:
- The basic properties of light, such as reflection, refraction, absorption, transmission and scattering.
- How to plot data points and determine the slope from the graph.
- The basic trigonometry (that is, the use of sine) for the calculation of refractive index using Snell's law.
Introduction/Motivation
(In advance, prepare to conduct a class demonstration, using the Disappearing Glass Demo Instructions as a guide, so the setup looks like Figure 1, with a stirring rod submerged in a beaker of water [left] and a stirring rod submerged in glycerin [right]. Write the challenge question on the classroom board. Then start by asking students the pre-assessment discussion questions, as described in the Assessment section. Then divide the class into groups of four and give each group a poster paper or small white board to write down its answers.)
What is the difference between transparent and invisible materials? (Listen to student answers.) Transparent material permits light to pass through it so that objects behind can be directly seen but the material itself is still visible to the naked eye. On the other hand, invisible material allows light to pass through as well, but it is not visible to our eyes.
Today, this is our challenge question: How can you make half of this stirring rod invisible without breaking it?
(Let students brainstorm and write down their final answers. Have each group share its answer and explain why. Summarize the answers on the classroom board.)
Let me show you one way of making half of the stirring rod disappear. (Demonstrate how to make half of the stirring rod disappear using two beakers, one with water and one with liquid glycerin.) What do you observe? (Students see examples of transparent and invisible materials, noticing that part of the rod submerged in glycerin appears to be invisible!)
(Expect some students to be fascinated. Others may have seen the demo but do not know the science behind it. Others may not believe it and examine the demo more carefully. Let students think about it and explore it for a few minutes. Then explain it.) If two materials have exactly the same refractive index (n), you cannot see the difference between the materials. Water has an n=1.33 while glycerin has n=1.47. A Pyrex stirring rod has n=1.47.
Light is very important in our lives. It travels in waves and has several unique properties—reflection, refraction, absorption, transmission and scattering. Light is the reason that we can see everything around us. However, have you ever thought that the unique properties of light could enable us to make something disappear? Before we get into making something "invisible," it is important for us to refresh our memories on what we mean by the refraction of light.
(Either introduce or review the concept of refraction.) Refraction is the bending of light as it passes from one medium to another. This behavior occurs because light changes speed when it travels into a different medium. Since light is used in a lot of research in science and engineering, it is important know how much light is refracting (or how much it changes its speed) in a given medium. Refractive index is one of the light optical properties that can be used to study the bending of light.
Procedure
Background
Refraction is the bending of light when it enters a different medium in which the speed of the light is changed. Refractive index (n) is a fundamental optical property of materials. Knowing the accurate value of material's n is significant in many science and engineering applications and in our daily lives. In optics, refractive index (n) is a dimensionless number that describes how light propagates through different media. It can be defined with the following equation: 
where c is the speed of light in a vacuum (3.0 x 10⁸ m/s) and v is the speed of light in a certain medium. In other words, n is simply a way to know the speed of light in a medium relative to its speed in a vacuum. Based on current knowledge, we know of nothing faster than the speed of light in a vacuum.
When light travels from one medium to another (such as from air to water), it bends, which is the phenomenon we call refraction. Light refracts due to the fact that its speed changes with respect to the medium in which it is travelling. Imagine that you are at a swimming pool and see a person drowning and shouting for help. Let us assume that you are the only one who can save that person. You are at position A and the drowning person is at position B (see Figure 3). Which is the fastest pathway to take to reach the drowning person?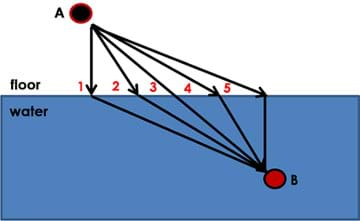
(Give students a chance to think about their answers and then share what they are thinking).
Even though pathway 3 is the shortest distance, pathway 4 is the fastest way. You can run faster on the ground than run or swim in water. Look the diagram closely. You have more time on the floor in pathway 4 than in pathway 3. Light behaves the same; it follows the fastest route from one place to another. This behavior is defined in an equation called Snell's law:
where n1 = refractive index of the first medium, n2 = refractive index of the second medium, θ1 = angle of incidence and θ2 = angle of refraction. The equation shows the relationship of the angle of incidence and the angle of refraction of light in two different media, as illustrated in Figure 4.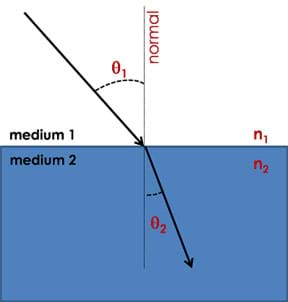
For Part 1 of today's activity, we are going to use Snell's law to determine the index of refraction of an unknown liquid. A semi-circular hollow block is the container of your unknown liquid and you are going to change the angle of incidence of the laser beam at 5o increments. Our first medium is the liquid and the second medium is the air. We will measure and record the angle of refraction in air. Then we will use the following relationship to determine the refractive index of the liquid (n1 ).
Snell's law is:
n1 sinθ1 = n2 sinθ2
If the second medium is air, we can assume that n2 = 1:
n1 sinθ1 = sinθ2
Recall:
y = mx+b
Let:
x = sin θ1
y=sin θ2
b=0
Then:
n1 sinθ1 = sinθ2 becomes y=n1x
and
Once you plot your data and the slope is determined, you can predict the identity of your unknown sample by referring to a list of known refractive indices of materials (Table 1).
As additional information, you can observe the total internal reflection (TIR) of light in the liquid (as shown in Figure 5). This phenomenon happens when the light is travelling in a denser medium and approaching to a less dense medium. In addition, the angle of incidence must be larger than a so-called critical angle. When the TIR happens, you will not see any refraction and instead, the light is reflected back. Total internal reflection is used in fiber optics and also in cutting of diamonds. For more TIR information, see the website and video listed in the Additional Multimedia Support section.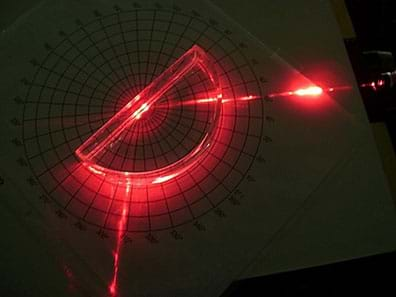
Part 2 of the activity involves the refractive index matching of a material (a Pyrex glass tube) with two different liquids (water and glycerin). Refractive index matching is used by science and engineering researchers, such as in the analysis of colloidal system using imaging. The study of colloidal particle behavior has been important in the development of efficient and eco-friendly solutions to many energy and environmental challenges such as enhanced oil recovery, flow assurance, water management, and clean and efficient engines. Observing these systems in a micro- or nano-scale dimension using microscopes is not easy since they usually scatter light in all direction because the particles are so close to each other. Too much scattering makes the microscopic images blurry and unclear. (One way to minimize this is to reduce the concentration of the particles in a medium. However, lowering the concentration can reduce the signal being detected to observe the particles.) If the particles and the solvent have the same refractive index, light scattering is not a problem. Thus, refractive index matching is a significant tool enabling researchers to better observe what happens in experiments.
Refractive index matching is tested by determining the percent light transmission. The refractive index of the glass tube is matched to the refractive index of two different liquids. Recall what you observed in the "disappearing glass" demo. The stirring rod submerged in glycerin appeared to be invisible! In theory, if two materials have exactly the same refractive index, the light passes through without any (or minimal) scattering or refraction. The light travels straight because it cannot detect any difference in the two materials, hence the speed of the travelling light does not change (bend). Related to this, the higher the percent transmission of light in the sample with a glass tube in a liquid, we can assume that the glass tube has the same or close n of that liquid. In this activity, we will use an inexpensive and easy-to-build homemade detector for measuring the light intensity (in milliwatts).
Before the Activity
- Gather materials and make copies of the Refractive Index Lab Worksheet and Refractive Index Application Research Questions.
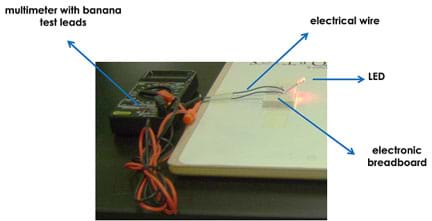
Figure 6. LED-multimeter detection system setup.
- Set up activity stations around the room with prepared samples for each team. The sample setup is shown in Figure 2, and an example station is shown in Figure 8. At each station, you may want to do steps 1 and 2 of Part 1 in advance of students arriving to conduct the activity.
- To ensure accurate data collection for Part 1, use clear tape to secure the semi-circular hollow block on the center of the polar graph. This minimizes movement of the block. Refer to Figures 5 and 7.
- For Part 2, set up the LED-multimeter detector as shown in Figure 6.
- If a lux meter is available, refer to the Refractive Index Lab Worksheet (Part 2, Analysis question #2) for information about the setup. This optional setup replaces the LED-multimeter detector with the lux meter. The percent transmission may not be the same since you are detecting light intensity in different units, but the trend will be similar.
With the Students—Part 1: Refractive Index Using a Hollow Cell

- Assign each group an "unknown" liquid. (Since students do not know that only samples of water and glycerin are available, give half of the class water and the other half glycerin.)
- Place the hollow semi-circular acrylic block filled with the group's assigned liquid at the center of the polar graph, as shown in Figure 4. If the polar graph is not protected by a plastic sheet, be careful not to get the paper wet!
- Use clear tape to secure the block to the graph. (Steps 1 and 2 may have already been done by the teacher.)
- Make sure that the laser pointer is working and lay it on the table so that the laser beam passes across the polar graph paper lying on the tabletop.
- Starting with the 0o angle of incidence from normal (the line that is perpendicular to the flat edge of the block), rotate the graph paper at 5o increments until the refracted ray totally disappears. (Refer to the setup in Figures 5 and 7.)
- Continue to change the angle of incidence by rotating the graph paper with the block, making sure that the light is always passing through the center point of the polar graph.
- Each time, record the angle of incidence (θ1 ) and angle of refraction (θ2 ).
- Take note of the angle at which the refracted ray totally disappears. This is called the total internal reflection. Teacher note: The critical angle (start of the total internal reflection) of light passing through water and air is 48.8° and for glycerin is 42.9°.
- Plot your data in terms of sinθ2 vs. sinθ1 . Determine the slope, which is the average refractive index. (Note: Recall Snell's law; nair = 1.00).
- Use your result to identify your liquid. Refer to Table 1 for the known refractive index of some liquids; it may be helpful to write this information on the classroom board.
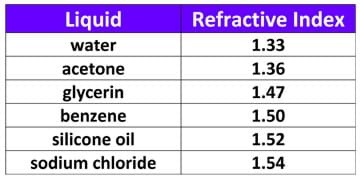
Table 1. Reference table for the refractive indices of various liquids.
With the Students—Part 2. Refractive Index Matching Using Percent Light Transmission Measurement

- Your goal is to approximate the index of refraction of the glass tube based on the percent light transmission using a LED light and multimeter as the detector.
- Provide each group with four labeled containers, each with a different sample inside, as identified in Table 2.
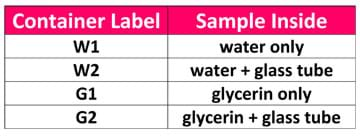
Table 2. Sample container labels and corresponding sample contents. - Turn on the laser and the multimeter. Make sure that the laser beam is passing through the LED light. The light from the laser is converted to an electric signal that is read by the multimeter. Adjust the laser position and light height until you can detect the maximum signal in volts (V). Light intensity is directly proportional to the voltage you are reading. The LED light has a maximum output of ~1.0 V. After this step, DO NOT MOVE the laser or the detector while gathering data. Misalignment may give different results.
- Put the W1 sample container in between the laser and detector. Make sure the light is passing through the center of the sample container and the LED light.
- Determine the light intensity (in volts) after the laser passes through the sample. Record your data.
- Repeat steps 3-5 for samples W2, G1 and G2, recording the data.
- Calculate the percent transmission of light using the equation provided in Figure 8.
- Determine the refractive index of the glass tube based from the known data. For teacher reference, two methods are described below.
Method 1: Refractive Index Matching: Based on the percent light intensity equation, I is the light intensity that the multimeter is reading with the liquid and glass tube, while Io is the reading with pure liquid. If the glass tube has the same refractive index as the liquid in which it is submerged, the light passes through it without any refraction or scattering; thus, its percent light intensity is almost 100%. This method is commonly called "refractive index matching" and is typically used in situations in which it is hard to measure the refractive index of a certain substance, such as colloidal and bacterial systems.
Method 2: Another way to determine the refractive index is by using two sample containers, each with a different liquid. Measure the light intensity after the light passes through the container with liquid only. Then, submerge the Pyrex glass tube, then measure the light intensity passing through the sample container (now with glass tube and liquid). Follow with the same equation.
- Conclude the activity by having students answer the three lab reflection questions. Then collect the completed lab worksheets. If time permits, have students research and present to the rest of the class examples of real-world applications of refractive index applications used in science and engineering, as described in the Activity Extensions section.
Vocabulary/Definitions
absorption: A process in which light (energy) is transferred to a medium in which it is passing through.
angle of incidence: The angle measured between the normal and the incident light.
angle of refraction: The angle measured between the normal and the refracted light.
colloidal system: A system in which fine particles are dispersed within a continuous medium. A colloidal system may be solid, liquid or gas.
detector: A device that recovers or measures information.
normal: An imaginary line perpendicular to a surface.
reflection: The bouncing of light when it strikes a boundary between different media through which it cannot pass.
refraction: The bending of light as it passes from one medium to another.
refractive index: A number (optical property) that describes how light propagates through a medium.
scattering: The dispersal of rays of light when the light reflects from an unsmooth surface.
transmission: When light passes through a material and is not absorbed by that material.
Assessment
Pre-Activity Assessment
Discussion Questions: To help students recall the common behaviors of light, give student pairs some time to discuss answers to the following questions. After the allotted time, have groups share their answers with the rest of the class. Answers to the following example questions are provided in the Pre-Activity Discussion Questions Answer Key.
- What is light?
- Light has the following behaviors when it is interacting with a certain boundary: reflection, refraction, absorption, transmission and scattering. For each, draw an example and use arrows to show how the light behaves.
- What is the difference between transparent and invisible?
Activity Embedded Assessment
Worksheets: During the course of the activity, have students complete the Refractive Index Lab Worksheet to show their understanding of the material as well as participation.
Post-Activity Assessment
Reflection Questions: At activity end, have students answer the three lab reflection summary questions and then turn in their completed lab worksheets. Review their answers to assess what they learned in the activity.
Safety Issues
- To keep the laser pointer from being pointed at people's eyes, use masking tape to secure the laser pointer in the setups before the activity begins.
- To prevent breakage and spills, place the activity glasses and liquids in a secure rack or container, such as the one shown in Figure 2 made from cardboard, tape and foam.
Troubleshooting Tips
For Part 1, make sure that 1) the laser beam passes through the polar graph so students can see the incident and refracted beam clearly, 2) the light passes through the center point of the graph, and 3) the block is at the center of the polar graph.
For Part 2, make sure the LED-multimeter detector is stable during data collection. Moving any part of the detector after step 2 of Part 2 may give erroneous results. The electronic breadboard is helpful to avoid moving any detector part during the activity.
Activity Extensions
Knowing the refractive index of a material enables us to predict the angle that light is bent as it passes through the material, which is important in many real-world applications, such as the imaging of nano-sized particles by minimizing the scattering due to refraction, as well as the design of optical instruments and equipment that use light. Assign student teams to research real-world applications of refractive index matching in science and engineering. Hand out the Refractive Index Application Research Questions as a guide for their research. Give each group five minutes to present what they have researched in class in the form of a PowerPoint and/or poster presentations. Note: With so many applications to research, guide student teams to focus on one application as their topic, so as to not be overwhelmed with too much information.
Additional Multimedia Support
For more information about total internal reflection (TIR):
- Applications of total internal reflection http://regentsprep.org/Regents/physics/phys04/captotint/
- Fiber Optic Cables: How They Work (5:35 minute video) https://www.youtube.com/watch?v=0MwMkBET_5I
Subscribe
Get the inside scoop on all things Teach Engineering such as new site features, curriculum updates, video releases, and more by signing up for our newsletter!More Curriculum Like This

Students learn about the basic properties of light and how light interacts with objects. They are introduced to the additive and subtractive color systems, and the phenomena of refraction. Students further explore the differences between the additive and subtractive color systems via predictions, ob...

Students learn about the science and math that explain light behavior, which engineers have exploited to create sunglasses. They examine tinted and polarized lenses, learn about light polarization, transmission, reflection, intensity, attenuation, and how different mediums reduce the intensities of ...
Copyright
© 2013 by Regents of the University of Colorado; original © 2013 University of HoustonContributors
Marjorie HernandezSupporting Program
National Science Foundation GK-12 and Research Experience for Teachers (RET) Programs, University of HoustonAcknowledgements
Developed by the University of Houston's College of Engineering under National Science Foundation RET grant number 1130006. However, these contents do not necessarily represent the policies of the NSF and you should not assume endorsement by the federal government.
Last modified: December 11, 2020


User Comments & Tips