Quick Look
Grade Level: 8 (8-9)
Time Required: 45 minutes
Expendable Cost/Group: US $25.00 The activity requires some non-expendable (reusable) items, such as an oscilloscope, power supply, breadboard circuit and electrodes; see the Materials List for details.
Group Size: 4
Activity Dependency:
Subject Areas: Biology, Science and Technology
NGSS Performance Expectations:

| MS-ETS1-4 |
| MS-PS4-1 |

Summary
Building on concepts taught in the associated lesson, students learn about bioelectricity, electrical circuits and biology as they use deductive and analytical thinking skills in connection with an engineering education. Students interact with a rudimentary electrocardiograph circuit (made by the teacher) and examine the simplicity of the device. They get to see their own cardiac signals and test the device themselves. During the second part of the activity, a series of worksheets, students examine different EKG print-outs and look for irregularities, as is done for heart disease detection.Engineering Connection
Biomedical engineers designed the electrocardiogram (EKG), giving healthcare professionals a way to assess heart irregularities in patients. An EKG can provide life saving early detection of potentially fatal heart conditions. Understanding how the heart works and how EKGs works, engineers can further develop new and better ways to detect heart diseases.
Learning Objectives
After this activity, students should be able to describe how the bioelectrical signal propagates though the heart and how that signal is able to be captured. In addition, they should be able to describe a biological problem as an engineer would.
Educational Standards
Each TeachEngineering lesson or activity is correlated to one or more K-12 science,
technology, engineering or math (STEM) educational standards.
All 100,000+ K-12 STEM standards covered in TeachEngineering are collected, maintained and packaged by the Achievement Standards Network (ASN),
a project of D2L (www.achievementstandards.org).
In the ASN, standards are hierarchically structured: first by source; e.g., by state; within source by type; e.g., science or mathematics;
within type by subtype, then by grade, etc.
Each TeachEngineering lesson or activity is correlated to one or more K-12 science, technology, engineering or math (STEM) educational standards.
All 100,000+ K-12 STEM standards covered in TeachEngineering are collected, maintained and packaged by the Achievement Standards Network (ASN), a project of D2L (www.achievementstandards.org).
In the ASN, standards are hierarchically structured: first by source; e.g., by state; within source by type; e.g., science or mathematics; within type by subtype, then by grade, etc.
NGSS: Next Generation Science Standards - Science
| NGSS Performance Expectation | ||
|---|---|---|
|
MS-ETS1-4. Develop a model to generate data for iterative testing and modification of a proposed object, tool, or process such that an optimal design can be achieved. (Grades 6 - 8) Do you agree with this alignment? |
||
| Click to view other curriculum aligned to this Performance Expectation | ||
| This activity focuses on the following Three Dimensional Learning aspects of NGSS: | ||
| Science & Engineering Practices | Disciplinary Core Ideas | Crosscutting Concepts |
| Develop a model to generate data to test ideas about designed systems, including those representing inputs and outputs. Alignment agreement: | Models of all kinds are important for testing solutions. Alignment agreement: The iterative process of testing the most promising solutions and modifying what is proposed on the basis of the test results leads to greater refinement and ultimately to an optimal solution.Alignment agreement: | |
| NGSS Performance Expectation | ||
|---|---|---|
|
MS-PS4-1. Use mathematical representations to describe a simple model for waves that includes how the amplitude of a wave is related to the energy in a wave. (Grades 6 - 8) Do you agree with this alignment? |
||
| Click to view other curriculum aligned to this Performance Expectation | ||
| This activity focuses on the following Three Dimensional Learning aspects of NGSS: | ||
| Science & Engineering Practices | Disciplinary Core Ideas | Crosscutting Concepts |
| Use mathematical representations to describe and/or support scientific conclusions and design solutions. Alignment agreement: Science knowledge is based upon logical and conceptual connections between evidence and explanations.Alignment agreement: | A simple wave has a repeating pattern with a specific wavelength, frequency, and amplitude. Alignment agreement: | Graphs and charts can be used to identify patterns in data. Alignment agreement: |
International Technology and Engineering Educators Association - Technology
-
Use appropriate symbols, numbers, and words to communicate key ideas about technological products and systems.
(Grades
3 -
5)
More Details
Do you agree with this alignment?
-
Advances and innovations in medical technologies are used to improve healthcare.
(Grades
6 -
8)
More Details
Do you agree with this alignment?
State Standards
National Science Education Standards - Science
-
Abilities of Technological Design
(Grades
K -
12)
More Details
Do you agree with this alignment?
-
Understandings About Science and Technology
(Grades
K -
12)
More Details
Do you agree with this alignment?
Materials List
For the basic pre-built EKG circuit built by the teacher:
- 4 - 10k resistors
- 1 - 10k variable resistor
- 1 - 39k resistor
- 1 - 47k resistor
- 1 - 100k resistor
- 1 - 220k resistor
- 2 - 470k resistors
- 2 - 1M resistors
- 2 - 470pF capacitors
- 1 - 1uF capacitor
- 1 - 2.2nF capacitor
- 1 - 4.7nF capacitor
- 5 - 741 op amps
- 4 - electronic project boxes
- 1 - breadboard
- Plus an oscilloscope, power supply, electrodes, wires, etc., as described in the EKG Diagram with Instructions
- overhead projector, to go over handout answers with the class
Most components can be found at Jameco at www.jameco.com or RadioShack at https://www.radioshack.com.
Worksheets and Attachments
Visit [www.teachengineering.org/activities/view/uva_pump_bme0607_act] to print or download.Pre-Req Knowledge
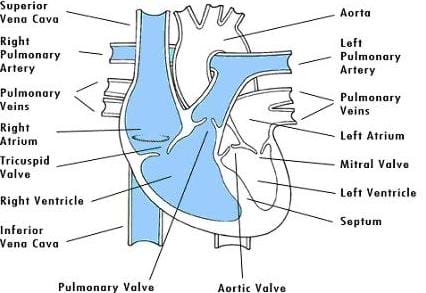
An understanding of heart function and how the electrical signal propagates, the basics of EKG signals and the connection between the physiological function and device measurements, basic electrical circuit knowledge and how electricity flows through electrical components.
Introduction/Motivation

Who has heard of an EKG? The electrocardiograph (EKG or ECG) is one of the most fundamental pieces of medical equipment. Physicians use this engineer-designed equipment to detect irregular heart rhythms caused by heart disease.
(This activity reinforces the concepts of bioelectricity and heart function taught in the associated lesson, The Strongest Pump of All: Electrical Heart Functions. Present students with the basic pre-built EKG circuit and hook it up to individual students to detect and visualize their heart rhythms. Then have students analyze some provided irregular EKG signals and anaytically decide what and why the patient has an irregular signal. Measure success by whether students are able to comprehend the function of an EKG in a clinical setting and if they are able use their own problem solving skills to deduct the physiological conditions connected to the EKG print-outs.)
Procedure
Overview for Teacher

In the first part of the activity, students are presented with the EKG circuit built by the teacher. The teacher places the black modules over each section of the circuit so that the students are able to visualize the function of each segment of the circuit. The teacher then removes the module covers and shows students that the device is not complex or mysterious.
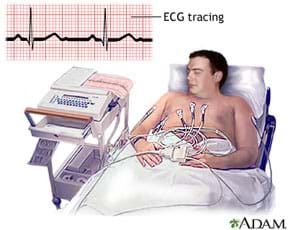
After that demonstration, the teacher connects the device to the power supply and connects the output of the circuit to the oscilloscope. Pick a student volunteer from the class. Place electrodes on the student's forearms and ankle while the student is seated in front of the class in close proximity to the device. Connect the detection leads from the circuit to the electrodes and turn on the power supply. The oscilloscope make visual the student's heart rhythm, just as a professional EKG would do. Make sure that the oscilloscope can be viewed by all the students in the classroom. If space permits and enough slack is available in the EKG leads, have the student jog carefully in place to increase his/her heart rate. Again, allow all the students to view the oscilloscope and make sure attention is drawn to the fact that the heart rhythm has increased. If time allows, connect another student to the oscilloscope to further the demonstration that the circuit functions, just as a professional EKG does.
The next section of the activity is in handout form. Divide the class into groups of four or five students each. Pass out the same handout to each member of the group. Direct students to discuss the handout and its questions carefully. While the students are discussing the handout in groups, walk around the classroom and answer any questions that arise. If more guidance is needed, give the class hints as to how to answer the questions. Allow enough time at the end of the class period to go over the handout questions as a class using an overhead projector or Elmo. The handout answers are designed to encourage students to develop an understanding of the different stages of heart failure. When connected in order, the EKG of handouts #1 through #4 show the process of heart failure. If desired, the teacher could further develop each condition by explaining additional medical details, such as the use of a defibrillator for treatment.
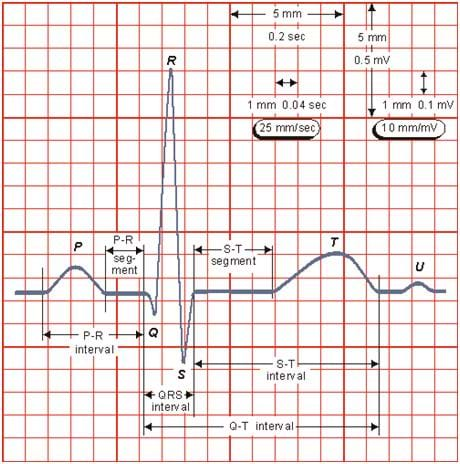
Background: Heart disease is the leading cause of death in the U.S. and is a major cause of disability. Almost 700,000 people die of heart disease each year, which is about 29% of all U.S. deaths. Heart disease is a term that includes several more specific heart conditions. The most common heart disease in the U.S. is coronary heart disease, which can lead to heart attack. The bio-potentials generated by the heart muscles result in an electrical signal called electrocardiogram (ECG or EKG). It is one of the most important physiological tests, used extensively for measuring the state of cardiac patients. An electrocardiograph enables a rapid observation of the behavior of the heart activity in terms of heart rhythm, conduction intervals, morphological aspects of the waves (P,Q,R,S,T) associated with depolarization and repolarization of the auricles and ventricles.
Before the Activity
- Teach the associated lesson.
- Construct the EKG circuit to the specifications in the EKG Diagram with Instructions.
- Test the EKG on the teacher or another adult before using it in the classroom.
- Make copies of the attached handouts so each group has a different handout.
- Make copies of the handout answers for use with an overhead projector.
With the Students
- Let each student examine the circuit with the modules covering each circuit component.
- Remove the module covers and let students view the circuit again.
- Connect the circuit to the power supply and the oscilloscope.
- Ask for a student volunteer to sit next to the circuit.
- Connect electrodes to the underside of the student's forearms and to the student's ankle.
- Connect the leads to the electrodes on the student and turn on the oscilloscope and power supply.
- Make sure all students can see the oscilloscope.
- If space and the length of the wires permit, ask the student to carefully jog in place.
- As everyone watches the oscilloscope, draw attention to how the signal has increased frequency.
- If time allows, ask for another student volunteer and repeat steps #6 through #9.
- Divide the class into groups of four or five students each.
- To each member of a group, pass out the same handout. Ideally, every group should be looking at a different handout.
- Direct students to discuss the handout questions within their groups.
- Walk around the room and observe how students are progressing through the questions.
- When satisfied that students have put forth enough effort in answering the questions, display the answers to the class using an overhead projector.
- After discussing the handouts, display the Stages of Heart Failure Handout and make connections among all of the different heart conditions and how they relate to EKGs.
- Collect students' completed handouts for grading.
Vocabulary/Definitions
action potential: A momentary change in electrical potential on the surface of a cell that occurs when it is stimulated, resulting in the transmission of an electrical impulse.
bioelectricity: An electric current that is generated by living tissue, such as nerve and muscle.
cardiac: Of, near, or relating to the heart.
EKG: Acronym for electrocardiograph. A medical instrument that records electric currents associated with contractions of the heart.
heart disease: Any disorder that affects the heart's ability to function normally.
heart rhythm: The pattern of heartbeats that result from electrical impulses that start in the sinoatrial (or sinus) node.
QRS: The electrocardiographic deflection representing ventricular depolarization; the initial downward deflection is termed a Q wave; the initial upward deflection, an R wave; and the downward deflection called an S wave.
Assessment
Handouts: Collect and review students' handouts to gauge their depth of comprehension.
Writing: At activity end, have students write in their lab journals, engineering notebooks or other paper a response to the following scenario:
- You be the biomedical engineer: Explain how the bioelectrical signal propagates through the heart and how that signal is able to be captured to a person who has just been diagnosed with a heart disease. Then, explain how an EKG captures this phenomenon.
Safety Issues
Students are connected to a teacher-built electronic circuit and the power supplied to the circuit could be harmful if the circuit were built incorrectly. The diagram shows a 10 k-ohm resistor between the electrode and the rest of the circuit for both the right and left arms. These resistors protect the student if the circuit is built incorrectly in most cases. If you are unfamiliar building electric circuits, it is worthwhile to engage the help of someone who has a bit more experience with electric circuits.
Troubleshooting Tips
From a technical aspect, the biggest challenge for the teacher is the construction of the EKG circuit. The electrical diagram included is in a standard form. The teacher may want to recruit help from a person with some experience in electrical circuits. If the circuit cannot be successfully constructed, a simple heart rate monitor from a pharmacy could partially replace the role of the EKG circuit in this activity. Using a simple heart rate monitor would not enable students to visualize the entire signal, but they could see how their heart rates increase/decrease with varying levels of activity.
Activity Extensions
Relating Heart Beat to Wave Energy
Explain to students that the amplitude of a wave is directly related to the energy of that wave. As the amplitude increases, the energy increases. Ask the students: "Of the three main waves (P, QRS, and T), which is the largest in amplitude?" [Answer: QRS.] This is the point at which blood is being pumped to the entire body, so more energy is needed to accomplish this. Show students the following diagram on a normal EKG and the following quantitative information on the amplitude of EKG waves. As students go through the four handouts in this activity, they can compare the irregular EKGs with these values to answer the questions more quantitatively.


Subscribe
Get the inside scoop on all things Teach Engineering such as new site features, curriculum updates, video releases, and more by signing up for our newsletter!More Curriculum Like This

Students learn how the heart functions. They are introduced to the concept of action potential generation, which causes the electrical current that triggers muscle contraction in the heart.
Copyright
© 2013 by Regents of the University of Colorado; original © 2007 University of VirginiaContributors
James Crawford; Katherine Murray; Mark Remaly; Shayn Peirce; Leyf PeirceSupporting Program
Biomedical Engineering, University of VirginiaAcknowledgements
Created by students in Dr. Shayn Peirce-Cottler's biomedical engineering senior design course.
Last modified: March 17, 2018


User Comments & Tips