
Quick Look
Grade Level: 11 (10-12)
Time Required: 2 hours
(two 60-minute sessions)
Expendable Cost/Group: US $5.00
Group Size: 5
Activity Dependency: None
Subject Areas: Algebra, Physical Science, Physics
NGSS Performance Expectations:

| HS-ETS1-4 |
Quick Look

- Grade Level:
- 11 (10 – 12)
- Time Required:
- 2 hours
(two 60-minute sessions)
- Group Size:
- 5
- Subject Areas:
-
Algebra Physical Science Physics -
NGSS Performance Expectations:
HS-ETS1-4

Summary
In this activity, students become biomedical and material engineers as they analyze material characteristics, composite characteristics and properties of a chicken bone under force. To understand these material characteristics, students perform a battery of tests at various “stations” around the classroom that evaluate the strengths and weaknesses of a product based on the material characteristics of its component materials.Engineering Connection
Biomedical engineers conduct tibia repair and replacement research on large animals such as pigs, sheep, and goats prior to transferring their research onto human clinical trials. Some biomedical engineers study animals in order to understand the quantitative mechanical properties of bones on a smaller level before devising tests for humans. Likewise, materials science engineers study the properties of materials and composites to develop the safest and strongest materials for those replacements.
Learning Objectives
After this activity, students should be able to:
- Evaluate the strengths and weaknesses of a product based on the material characteristics of its component materials.
- Describe what is meant by stress, strain, and Young’s Modulus.
- Understand stress-strain and force-displacement relationships.
- Differentiate between compression and tension.
- Apply a force sensor to a sample to collect and analyze data.
- Explain the role of a materials and/or biomedical engineer.
- Work as a team to construct a model consistent with a design and given specifications.
Educational Standards
Each Teach Engineering lesson or activity is correlated to one or more K-12 science,
technology, engineering or math (STEM) educational standards.
All 100,000+ K-12 STEM standards covered in Teach Engineering are collected, maintained and packaged by the Achievement Standards Network (ASN),
a project of D2L (www.achievementstandards.org).
In the ASN, standards are hierarchically structured: first by source; e.g., by state; within source by type; e.g., science or mathematics;
within type by subtype, then by grade, etc.
Each Teach Engineering lesson or activity is correlated to one or more K-12 science, technology, engineering or math (STEM) educational standards.
All 100,000+ K-12 STEM standards covered in Teach Engineering are collected, maintained and packaged by the Achievement Standards Network (ASN), a project of D2L (www.achievementstandards.org).
In the ASN, standards are hierarchically structured: first by source; e.g., by state; within source by type; e.g., science or mathematics; within type by subtype, then by grade, etc.
NGSS: Next Generation Science Standards - Science
| NGSS Performance Expectation | ||
|---|---|---|
|
HS-ETS1-4. Use a computer simulation to model the impact of proposed solutions to a complex real-world problem with numerous criteria and constraints on interactions within and between systems relevant to the problem. (Grades 9 - 12) Do you agree with this alignment? |
||
| Click to view other curriculum aligned to this Performance Expectation | ||
| This activity focuses on the following Three Dimensional Learning aspects of NGSS: | ||
| Science & Engineering Practices | Disciplinary Core Ideas | Crosscutting Concepts |
| Use mathematical models and/or computer simulations to predict the effects of a design solution on systems and/or the interactions between systems. Alignment agreement: Analyze data using tools, technologies, and/or models (e.g., computational, mathematical) in order to make valid and reliable scientific claims or determine an optimal design solution.Alignment agreement: Use a model to predict the relationships between systems or between components of a system.Alignment agreement: | Both physical models and computers can be used in various ways to aid in the engineering design process. Computers are useful for a variety of purposes, such as running simulations to test different ways of solving a problem or to see which one is most efficient or economical; and in making a persuasive presentation to a client about how a given design will meet his or her needs. Alignment agreement: | Models (e.g., physical, mathematical, computer models) can be used to simulate systems and interactions—including energy, matter, and information flows—within and between systems at different scales. Alignment agreement: |
Common Core State Standards - Math
-
Reason abstractly and quantitatively.
(Grades
K -
12)
More Details
Do you agree with this alignment?
-
Model with mathematics.
(Grades
K -
12)
More Details
Do you agree with this alignment?
-
Calculate and interpret the average rate of change of a function (presented symbolically or as a table) over a specified interval. Estimate the rate of change from a graph.
(Grades
9 -
12)
More Details
Do you agree with this alignment?
-
Graph square root, cube root, and piecewise-defined functions, including step functions and absolute value functions.
(Grades
9 -
12)
More Details
Do you agree with this alignment?
-
For a function that models a relationship between two quantities, interpret key features of graphs and tables in terms of the quantities, and sketch graphs showing key features given a verbal description of the relationship.
(Grades
9 -
12)
More Details
Do you agree with this alignment?
-
Summarize, represent, and interpret data on two categorical and quantitative variables
(Grades
9 -
12)
More Details
Do you agree with this alignment?
International Technology and Engineering Educators Association - Technology
-
Students will develop an understanding of the attributes of design.
(Grades
K -
12)
More Details
Do you agree with this alignment?
-
Students will develop an understanding of engineering design.
(Grades
K -
12)
More Details
Do you agree with this alignment?
-
Use computers and calculators to access, retrieve, organize, process, maintain, interpret, and evaluate data and information in order to communicate.
(Grades
9 -
12)
More Details
Do you agree with this alignment?
-
Conduct research to inform intentional inventions and innovations that address specific needs and wants.
(Grades
9 -
12)
More Details
Do you agree with this alignment?
-
Use various approaches to communicate processes and procedures for using, maintaining, and assessing technological products and systems.
(Grades
9 -
12)
More Details
Do you agree with this alignment?
State Standards
Connecticut - Math
-
Model with mathematics.
(Grades
K -
12)
More Details
Do you agree with this alignment?
-
Reason abstractly and quantitatively.
(Grades
K -
12)
More Details
Do you agree with this alignment?
-
Calculate and interpret the average rate of change of a function (presented symbolically or as a table) over a specified interval. Estimate the rate of change from a graph.
(Grades
9 -
12)
More Details
Do you agree with this alignment?
-
Graph square root, cube root, and piecewise-defined functions, including step functions and absolute value functions.
(Grades
9 -
12)
More Details
Do you agree with this alignment?
-
For a function that models a relationship between two quantities, interpret key features of graphs and tables in terms of the quantities, and sketch graphs showing key features given a verbal description of the relationship.
(Grades
9 -
12)
More Details
Do you agree with this alignment?
-
Summarize, represent, and interpret data on two categorical and quantitative variables
(Grades
9 -
12)
More Details
Do you agree with this alignment?
Materials List
Mini-Lesson:
The teacher needs:
Each student needs:
Stereognosis Station:
Each group needs:
- sleep masks, blindfolds, or bandannas (one per student)
- foam samples mounted to something such as a plastic lid (see Before the Activity section)
- paper lunch bags (one per sample)
- Stereognosis Activity Worksheet, one per person
To be used by the teacher ahead of time:
- Mr. Clean Magic Eraser sponge
- Blue Cello Kitchen sponge
- X-Acto knife or sharp scissors
- punch tool set
- rubber mallet
- hot glue gun and glue
- 6 plastic lids (Noosa Yogurt tops ~4.5-inch diameter work well)
- chicken drumsticks (two to three packages, depending on number of students)
- 3.75 L vinegar
- 1 L mason jars (enough to calcify a number of chicken bones)
I Don’t Wanna Be a Chicken Station:
Each group needs:
- laptop or Chromebook with access to Desmos (www.desmos.com), a free online graphing calculator. In order to save or share files, students can create an account or login using their school Google account.
- I Don’t Wanna Be a Chicken Activity Worksheet, one per person
- Specimen Data Set (A, B, or C) to be assigned by the teacher (see I Don’t Wanna Be a Chicken Activity Worksheet)
- printed copy or link to 3-Point Bend Test on a Mouse Scholarly Article
No Bones About It Station:
Each group needs:
- No Bones About It Activity Worksheet, one per person
- decalcified chicken bone cross sections: one hollow core, soft core, one hard core
- pair of safety glasses for each student handling the chicken bones or punching foam samples
- pair of rubber gloves for each student handling the chicken bones
To share with the entire class:
- Arduino-controlled stepper-motor driven load cell with staging area, see Force Sensor Instructions PowerPoint and explanations on Arduino.cc
- USB Microscopic camera with respective image-capture software, see Force Sensor Instructions PowerPoint
- desktop or laptop with Arduino software and ImageJ software (or comparable)
- various foams and soft materials (one soft foam such as Mr. Clean Magic Eraser and a hard foam such as a discount store stadium cushion or gardening knee pad, or organic materials such as marshmallows or gummy bears)
- leather hollow punch tool set
- rubber mallet
- container of antibacterial wipes
- absorbent mat pads to cover the work surface (if scientific pads not available, use puppy training pads)
Worksheets and Attachments
Visit [www.teachengineering.org/activities/view/uconn-2400-cracking-bone-force-design-activity] to print or download.Pre-Req Knowledge
Knowledge of stress-strain relationships, force-displacement relationships, and Young’s modulus. See Stress-Strain Mini-Lesson PowerPoint (Teacher Version) with space for student work in accompanying Stress-Strain Mini-Lesson PowerPoint (Student Version).
Introduction/Motivation
Do you know anyone who required surgery to repair an injury to a bone? Did you ever wonder who decides whether or not a material is appropriate for the human body? Should it be a soft material like your skin and muscles or a hard material like your bones? Or, perhaps it should be something in between or even a composite of both? Should it go outside your bones or inside?
Bone replacement is an often necessary procedure following a traumatic accident or after a prolonged illness. To provide medical practitioners with optimal replacements, biomedical engineers conduct tibia repair and replacement research on large animals such as pigs, sheep, and goats prior to transferring their research onto human clinical trials. Some biomedical engineers study animals in order to understand the quantitative mechanical properties of bones on a smaller level before devising tests on humans. Likewise, materials engineers study the properties of materials and composites to develop the safest/strongest/best materials that can be used to in those replacements.
Today you will take on the role of biomedical and material engineers! You will compare material characteristics for hardness, strength and flexibility as you research bone replacement for humans. There will be three stations you will rotate through: Stereognosis Station, I Don’t Wanna Be a Chicken Station, and No Bones About It Station. At these stations you will you will look at material characteristics, analyze composite characteristics and be introduced to the properties of a chicken bone with the idea in mind that someone, somewhere is doing research to improve bone replacement in humans.
Procedure
Background
Stereognosis Station: Everything is made from something. Be it a bridge, a cell phone case, a football, an abdominal aortic aneurism mesh, or a contact lens, an engineer studies the properties of the materials to understand its limitations and improve its properties. Watch a short video clip which provides an introduction to the world of Materials Science and Engineering: What is Materials Science?
I Don’t Wanna Be a Chicken Station: In a three-point bend test, a beam (in this case a brittle chicken bone) is supported on both ends while a concentrated load, or force, is applied at the center. Mechanical Engineers run a test called finite element analysis on materials that will be used for an eventual product be it commercial or medical. In order to understand the safety limitations of a material, engineers determine the way in which it behaves under varying conditions. It is important to understand what conditions a material fails so that it is not used under such conditions.
No Bones About It Station: Biomedical engineers continuously research new materials in order to advance medicine including wound healing, tissue and organ growth, and bone repair/replacement. They also study bone strength in humans to create products that protect the body during sports and to protect the elderly during falls. In addition, they create replacement products using materials that mimic the human bone.
Before the Activity
- Assign students to groups.
- Assign groups to a starting station. Place Station Summary Signs at each station. These will help students familiarize themselves with the activity.
Stereognosis Station:
- Make copies of the Stereognosis Worksheet.
- Make a variety of foam samples, some whole, some with hollow cores, and some composites. Mount each sample to a plastic lid for orientation purposes and place each in a paper bag. Alternatively, have blindfolds available. Suggested materials are Cello kitchen sponges and Mr. Clean Magic Eraser sponges. Some possible sample combinations are shown below:
- Use the X-Acto knife to cut three pieces of the Mr. Clean Magic Eraser and three pieces of the blue Cello Kitchen sponge. Each piece should have a 2.5 cm square footprint.
- Use the punch tool to cut a circular hole completely through two of each type of sample; leave the third one of each solid.
- Insert one of the blue cutouts into the hold of a white sample and vice versa.
- Rotate each sample 90 degrees so that when mounted on the lids, the cutouts are viewed on the side and not from the top. See Figure 1.
- Glue each sample to a plastic lid with a tiny dot of hot glue so as not to melt the lids.

I Don’t Wanna Be a Chicken Station:
- Make copies of or provide an online link to the referenced scholarly article available for students to read: 3-Point Bend Test on a Mouse Scholarly Article.
- Make copies of the I Don’t Wanna Be a Chicken Worksheet.
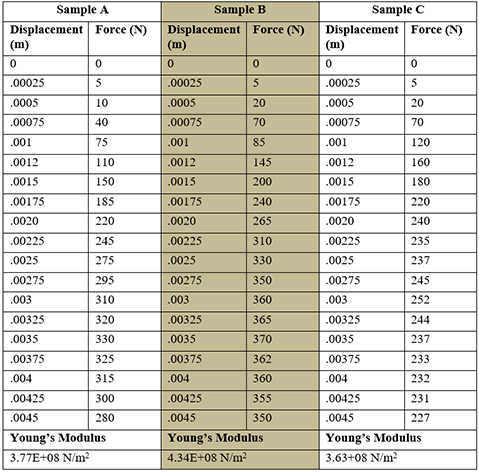
- Assign each group a data table from Specimen A, B, or C. The data is included on the worksheet. Having multiple data sets is more realistic.
No Bones About It Station:
- Purchase one 1 L (32 oz.) wide-mouth glass mason jars per every two bones you want to use. Each bone produces three or four samples but the ones closer to the center of the bone are more uniform.
- Purchase enough vinegar to fill each jar.
- Two to three weeks prior to the activity, purchase two to three packages of drumsticks per class. The smaller the bones the better. Try to find packages with even sizes; you do not want some large and some small.
- Boil the drumsticks and remove the meat. Use warm water to clean them as much as possible.
- Place the bones in the jars and cover with vinegar. Let them sit for a week. Change the vinegar and let them sit for another week.
- Build (see Force Sensor Instructions PowerPoint) or obtain a force sensor.
- Set up and calibrate a force sensor text fixture complete with a stage. (A stage can be as simple as an upside down clay pot with a metal plate on top.) See Force Sensor Instructions PowerPoint.
- Set up the microscopic camera and image capturing software.
- Download ImageJ on the same or another laptop. A second laptop is recommended to save time. While one group is collecting data another can be analyzing data Download ImageJ here.
- Instruct students in the use of the force sensor such as moving the stepper motor up and down (if your setup includes this).
- Instruct students how to record a force measurement.
- Instruct students how to use ImageJ (or similar software) to take an image after each force is applied.
- Prepare cross sections of decalcified chicken bones. The center sections of each drumstick work best. Squeeze out and dispose of the marrow then place the cut and unused bones back in the jar until ready to use.
- Prepare a variety of samples that can be selected as the soft inner core and the hard inner core. For example: foam, sponge, gummy candy, marshmallow, screw/nail, etc. The items have to be small enough to fit inside the core of the chicken bone core. A leather punch tool is helpful to cut samples ahead of time. You may wish to use a rubber mallet and cutting mat as well. An X-Acto knife is also helpful. If students will be doing the preparations, then make sure they use safety glasses and employ additional safety measures.
- Make copies of the No Bones About It Worksheet.
With the Students
Stereognosis Station Procedure: Students rely only on their sense of touch to determine the perceived Young’s Modulus of sample materials.
- Students take turns wearing a blindfold and reaching into a paper bag containing a mounted sample.
- For each sample, the students should press down on the sample and make a note of its softness. See Figure 2.
- After examining all of the samples while blindfolded, the students should individually rank their observations and order the samples from softest to stiffest using the Stereognosis Worksheet.
- Students should then compare their rankings with each other.
- Next, the students repeat the process while able to view the samples, and again individually rank their samples from softest to stiffest.
- Finally, they compare the results and make conjectures about why their sorting results differed without and with the use of vision.
- Afterwards, each set of partners should watch the video, What is Materials Science?


I Don’t Wanna Be a Chicken Station: Students analyze an assigned set of force-displacement data from a three-point bend test of a brittle chicken bone, define region subsets, and determine the yield force, determine the breaking force, and calculate the value of stiffness. Next, they graph the data and determine the best-fit models (linear, quadratic, or higher-order polynomial) for each region along with the corresponding domains resulting in an overall piecewise-defined function.

- Students are presented with a three-point bend test scenario in which, a beam (in this case a brittle chicken bone) is supported on both ends while a concentrated load, or force, is applied at the center (see Figure 3). The applied force results in compression on the top of the bone and tension on the bottom of the bone as shown. Since this test requires equipment that is not commonly available, each group is given a table of information (see the I Don’t Wanna Be a Chicken Worksheet) which represents force versus displacement data from a 3-point bend test collected in a lab with appropriate equipment (Figure 4). The teacher assigns Specimen A, B, or C.
- Students use the online graphing app Desmos (www.desmos.com) to insert a table and create a scatterplot of the data. Students can use the wrench tool to adjust the window appropriately so all data points are visible. Students can create an account or login with their school Google account to save their file.
- Students analyze the force-displacement scatterplot and determine the three regions: the elastic region, the deformation region, and the point of fracture as shown by the sample graph in Figure 5.

- Using the scatterplot as a reference, students circle and label the points on the data table sample that best represent the different regions.
- Using the data and the graph, students determine the force at the YIELD point and the force at the FRACTURE point. Teachers should emphasize the use of units.
- Next, students separate the data into two different tables in Desmos. The first table holds the linear data and the second the non-linear data in the ductile region. Students can delete the latter (ductile) portion from the original table and enter that data into a second table. The first table uses x1 and y1 while the latter uses x2 and y2. Students should assign a different color for each table.
- Students run a linear regression on the first data set, restrict the domain appropriately, and match the color of the line to the data set. Students record the slope-intercept equation along with the restricted domain using interval notation. In Desmos, students run a linear regression by inserting an expression and the domain in the form y1= ax1 + b {# ≤ x1 ≤ #}. (Desmos automatically makes the subscripts but it is up to the student to match the number with the data in the table.)
- Students determine the stiffness of the chicken bone from the slope of the linear equation. Teachers should emphasize the use of units.
- If there is ample time, students can collect stiffness data from all groups and find the average. Students should complete the table in the worksheet and include units. You may have to wait a few days for all groups to rotate through this station.
- Next, students find the Young’s Modulus for their assigned data set keeping in mind the average age of a chicken at slaughter is 6 weeks. They compare this value to the Young’s Modulus of a two-month old female mouse from the following scholarly article: Bone Mechanical Testing by Three-Point Bending.
- Students are asked to analyze why their results do or do not make sense and explain their answer.
- They then compare the Young’s Modulus in this activity compare with the Young’s Modulus of a 20-month old female mouse from the article referenced in the previous question, noting that in the wild, mice tend to live only five or six months; however, in ideal indoor conditions they can, live up to two years.
- Students use Desmos to run a higher-order polynomial regression on the second data set representing the ductile region. Students need to experiment with regression functions to determine if the function is best modeled by a quadratic, cubic, or quartic by noting the R2 value; however, if the value does not change much, there is no point in adding complexity using a higher-ordered function. Students make note of the selected polynomial and record the equation. (In Desmos, students will add an expression of the form y2 = ax22 + bx2 + c or y2 = ax23+ bx22 + cx2 + d along with the restricted domain {# ≤ x2 ≤ #}.) Students record the deformation region’s best-fit polynomial along with the restricted domain, using interval notation. Note: Since the domain starts with where the linear equation ended, one should be closed and the other open in the interval notation. (Students may have to use closed notation in Desmos in order for the graph to show, but should record the intervals properly on their paper.)
- Students should record a complete piece-wise defined function for the entire data set on paper.

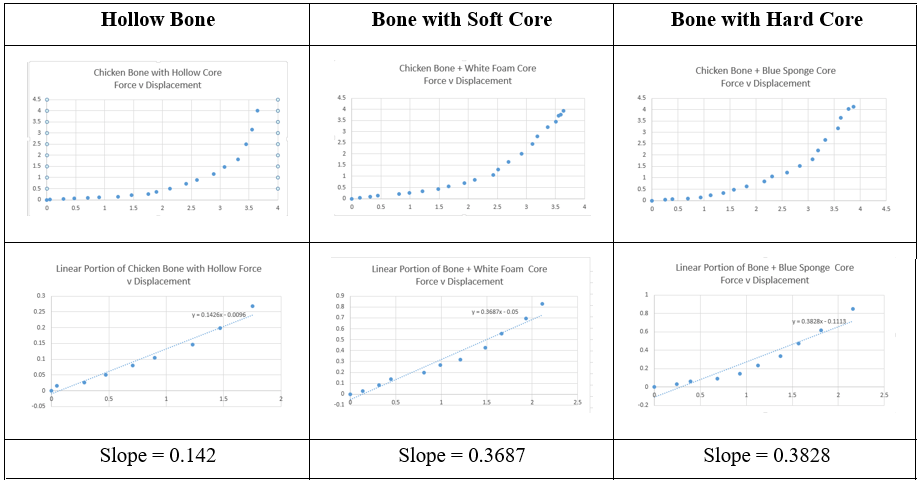
No Bones About It: Students use a force sensor and microscopic camera to collect data, graph the data, analyze the results, and calculate the Young’s Modulus of a decalcified chicken bone. They analyze a hollow piece as well as two other samples: one with a soft core and one with a hard core. Students make conjectures prior to testing and then draw conclusions about the results of their data.
- Students should familiarize themselves with the items at the sample preparation area. This area should have the jars of decalcified chicken bones soaking in vinegar, absorbent mat pads, rubber gloves, various foam samples, a punch tool set, and a rubber mallet.
- Using rubber gloves, teachers can either prepare slices of the bones ahead of time (about a ½-inch thickness) or let the students make them as needed. The marrow will need to be removed and discarded to make room for the foam cores.
- While wearing rubber gloves, students use a ruler or a set of calipers (if available) to measure the diameter of the chicken bone core. Students then select a foam, put on safety glasses, and use the appropriate-size punch tool and the rubber mallet to prepare a foam core. Once the foam core is inserted in the hollow chicken bone, the sample is ready. Each group should have three samples: a hollow core, a soft core, and a hard core. (Sponges tend to be softer than stadium seat cushions or garden kneelers.)
- Students should move to the force-sensor area and familiarize themselves with the equipment. This area has a staging area on which to place one sample at a time. The force sensor sits above the staging area and a microscopic camera sits adjacent to it. A desktop or laptop computer controls the Arduino board which moves the stepper-motor and load cell as well as controls the microscopic camera and respective image-capture software. Students use the test fixture to collect data on one sample at a time as follows, beginning with the hollow core chicken bone. See the No Bones About It Worksheet for complete instructions.
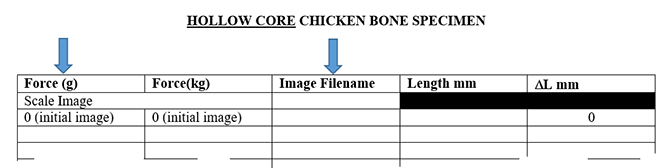
- Students should share all data with all members in the group, convert the force data from grams to kg in the corresponding chart column, and calculate ∆L (the displacement) by subtracting the ImageJ measurement in each row from the length recorded in the initial picture. See Figure 6.
- Using Desmos, students insert a table, and record ∆L (in mm) in the x1-column and force (in kg) in the y1-column. They then use the wrench tool to adjust the window so that all of the data points on the scatterplot are visible.
- Using the force-displacement scatterplot as a reference, students should be able to identify the different regions: elastic region, deformation (or ductile) region, and the point of fracture. Likewise, students should circle and label the points on the data table that best represent the different regions.
- Students should break the original data into two data tables. The first table holds the linear data and the second the non-linear data in the ductile region. Students should assign distinct colors to the two different regions.
- Students insert an expression underneath the data table and run a linear regression on the first data set, restricting the domain appropriately matching the color of the line to the data set. Hint: the Desmos command to do this is y1= ax1 + b {# ≤ x1 ≤ #}.
- Students record the slope-intercept equation along with the restricted domain using interval notation for each sample on their worksheet. Students use this information to determine the stiffness of each sample. Teachers should encourage the use of units.
- Students use Desmos to run a higher-order polynomial regression on the second data set representing the ductile region. Students will have to experiment with regression functions to determine if the function is best modeled by a quadratic (y2 = ax22 + bx2+ c), cubic (y2= ax23+ bx22+ cx2 + d), or quartic (y2 = ax24+ bx23+ cx22 + dx2 + e) by referencing the R2 value; however, if the value does not change much, there is no point in adding complexity using a higher-ordered function. Students record the deformation region’s best-fit polynomial along with the restricted domain, using interval notation. Note: Since the polynomial domain starts with where the linear function ended one should be closed and the other open in the interval notation. (Students may have to use closed notation in Desmos in order for the graph to show but should record it correctly on paper.)
- Students write a complete piece-wise defined function for the entire data set for each specimen.
- Students analyze their linear equations and order of the samples from least to greatest in stiffness and explain how they arrived at the answer. They compare their results to their initial predictions and draw conclusions.
- At the end of the unit, the group shares all Desmos graphs with their teacher by emailing the links; they turn in this document and all data collection worksheets as well.


Vocabulary/Definitions
composite: A material formed by combining two or more materials that have different properties, that gives the composite material its own unique property.
compression: Application of inward “pushing” forces to different points on a material or structure.
core: Central or innermost part of anything.
displacement: Measurement of how much an object has been compressed or stretched in comparison to its original length.
domain: Set of values of the independent variable(s) for which a function or relation is defined; in a mathematical functions, these are typically known as the x-values.
ductile: Region on a stress-strain graph where an object under stress will retain its deformation even after the stress is removed.
elastic: Region on a stress-strain graph where the object under stress will return to its original shape once the stress is removed.
elastic deformation: A non-permanent deformation in which the original shape returns upon remove of the stress.
elastic modulus: The ratio of stress to strain in the elastic (linear) region; this term is also used to describe the measure of a material's stiffness. Also known as Young's Modulus.
force: A push or a pull on an object resulting in movement or change in shape.
function: A relation for which each input value has one and only one output value.
load cell: A transducer which creates an electrical signal the magnitude of which is directly proportional to the force being measured.
materials science: Scientific study of the properties and characteristics of materials, particularly solids, often with the goal of developing new materials.
polynomial: An expression consisting of more than two algebraic terms.
stereognosis: Mental perception of depth by the senses, usually by touch.
stiffness: The extent to which a material resists deformation in response to an applied force.
strain: An observed change in an object's shape compare to its original length after application of a stress.
stress: Application of force to an object resulting in deformity.
tension: A pulling force.
yield point: Point on a force-displacement graph representing where an object reaches the point of irreversible deformation.
Assessment
Pre-Activity Assessment
Discussion Questions: Ask the following questions:
- Which comes first, stress or strain?
- How are stress and strain related?
- Why does strain have no units?
- True or False: Stress can only result from pushing on an object.
- Have you ever broken an object using compression?
- Have you ever broken an object using tension?
- What is Young’s Modulus?
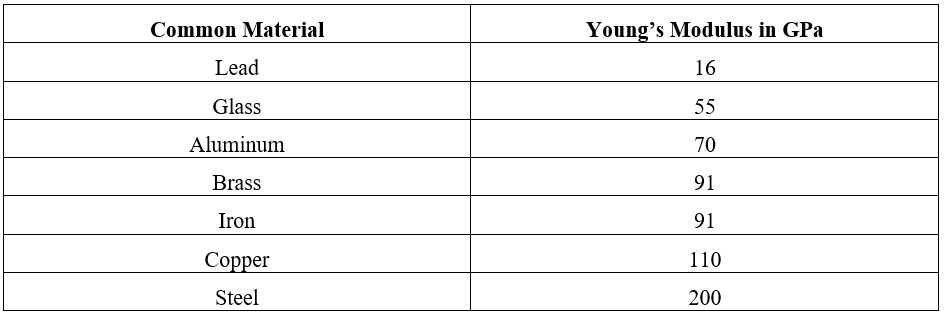
Force is applied to an object either by pushing (compression) or pulling (tension). The applied force creates stress which produces strain. Stress is the force divided by the cross-sectional area and strain is the resulting compression/elongation deformity that results for a particular sample. Since strain is the ratio of two lengths of like units, the resulting value is dimensionless. Young’s modulus is the ratio of stress to strain and is also called a Modulus of Elasticity. The Young’s Modulus of some common materials is shown below:
Activity Embedded Assessment
Questions: See questions included on the activity worksheets.
Post-Activity Assessment
Post-Assessment Worksheet: Have students complete the Post-Activity Assessment. Note: The worksheet can be used as group discussion questions or given as an individual written post-test.
Investigating Questions
When is it appropriate to use stress-strain as compared to force-displacement data?
Answers or prompts for further discussion:
Stress-strain calculations require knowing or calculating the cross-sectional area of the sample. The Young’s Modulus of a material depends on the slope of the linear region of the stress-strain graph. The formula for stress is:
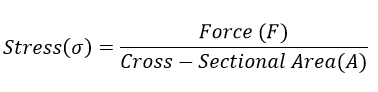
Hence, when testing a composite material, it is difficult to determine the cross-sectional area and therefore easier to calculate stiffness using a force-displacement graph.
When testing a uniform single-component sample, engineers use the Young’s Modulus value which is a true material property―one that is independent of the size of the sample.
Stress is found by dividing the force (or load) by the sample area and strain is found by dividing displacement by the sample length. Young’s Modulus is determined by then dividing the stress by the strain, which is a true material property whereas stiffness is a property of a specific sample under test.
In a composite material, it is not possible to determine a meaningful stress because the load is divided between the two (or more) different components of the composite material.
To clarify, recall:
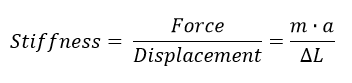
and is measured in N/m for units.
A constant force applied to a sample that is twice as thick will only be displaced half as much and therefore will have twice the stiffness:
Students may require help in simplifying the compound fraction of Sample 2.
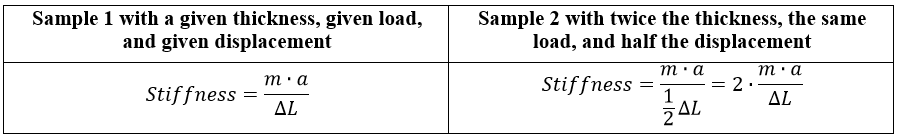
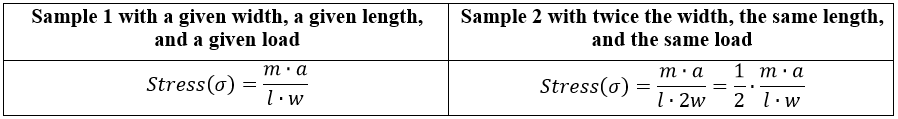
Recall:
and is measured in N/m2 or Pa.
A sample with a rectangular base under a constant force with twice the thickness will have twice the area and therefor results in half the stress:
How does this change if the sample is cylindrical with a circular base when doubling the thickness (diameter)?
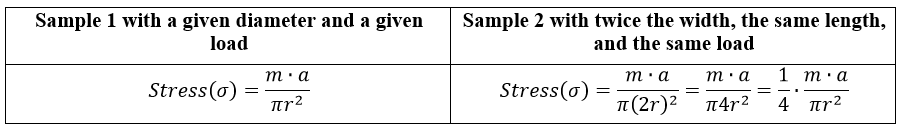
By doubling the thickness (diameter) you quarter the stress!
Recall strain is defined as:
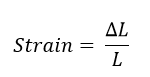
and is therefore dimensionless. (This is a difficult concept for high school students who have been drilled to use units!)
What is the resulting strain on a sample which is twice as thick (no matter what the shape) and produces half the displacement?
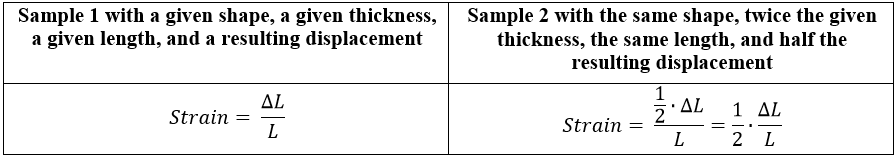
The result is it produces half the strain.
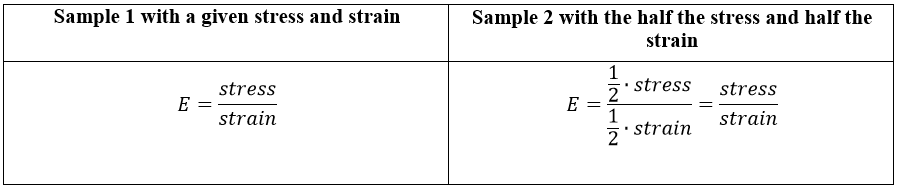
Finally, recall Young’s Modulus is defined as:
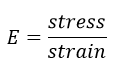
If you have a thickness doubling case where you halve both the stress and the strain, the Young’s modulus remains unchanged:
Safety Issues
No Bones About It Station:
- Students at the force sensor should wear safety glasses.
- If students are creating their own composite samples, provide proper training and safety measures when using any tools.
Troubleshooting Tips
Stereognosis Station:
- Be prepared for students to try to “cheat” by removing the blindfold. Remind students that this is a participation grade for experience.
- Reassure students that there are no animal bones or “gross” items and that because they are working in groups, only one student is required to do the touching.
I Don’t Wanna Be a Chicken Station:
- Be prepared for students to forget the format of a regression equation in Desmos or to use incorrect subscripts.
No Bones About It Station:
- Soak the chicken bones in vinegar for one to two weeks ahead of doing the lab. Although online resources predict three to five days, this will not be soft enough unless you have an extra strength industrial strength force sensor at your disposal. (i.e., a 50 kg load cell can be used.) Swap out the vinegar after the first week.
- Test a few composite samples in advance of the activity to make sure students will be able to make the samples if you are not making them in advance.
- Have extra materials available (especially chicken bones) in case students damage their sample.
- Some students may not tolerate the odor of vinegar; likewise, not all students will want to handle the chicken bones. For each group, only one person is required to handle the chicken bones. As an alternative, you could try partially cooked penne pasta.
Activity Scaling
- For upper-level students, have them test additional composite samples.
- For lower-level students, each group should only test one sample and the groups will compile their data.
Additional Multimedia Support
Stereognosis Station: Video: What is Materials Science?
Subscribe
Get the inside scoop on all things Teach Engineering such as new site features, curriculum updates, video releases, and more by signing up for our newsletter!More Curriculum Like This

After learning, comparing and contrasting the steps of the engineering design process (EDP) and scientific method, students review the human skeletal system, including the major bones, bone types, bone functions and bone tissues, as well as other details about bone composition. Students then pair-re...

Students extend their knowledge of the skeletal system to biomedical engineering design, specifically the concept of artificial limbs and joints. Students relate the skeleton as a structural system, focusing on the leg as structural necessity. They learn about the design considerations involved in t...

Students learn how forces affect the human skeletal system through fractures and why certain bones are more likely to break than others depending on their design and use in the body. They learn how engineers and doctors collaborate to design effective treatments with consideration for the location, ...

Copyright
© 2019 by Regents of the University of Colorado; original © 2018 University of ConnecticutContributors
Diane Walsh, Joules Fellow, Coginchaug Regional High School, Durham, CT; Soliman Alhudaithy, Bio-Sensors Lab, School of Engineering, University of Connecticut.; Dr. Kazunori Hoshino, Bio-Sensors Lab, School of Engineering, University of Connecticut.; Ashley LaPane, Joules Fellow Lab Partner and Science Teacher, Canton Middle School, Canton, ConnecticutSupporting Program
Joule Fellows Program, School of Engineering, University of ConnecticutAcknowledgements
This curriculum was developed under National Science Foundation GK-12 grant no. 1711706. However, these contents do not necessarily represent the policies of the NSF, and you should not assume endorsement by the federal government.
Last modified: August 8, 2025
User Comments & Tips