Summary
Students explore how the efficiency of a solar photovoltaic (PV) panel is affected by the ambient temperature. They learn how engineers predict the power output of a PV panel at different temperatures and examine some real-world engineering applications used to control the temperature of PV panels.Engineering Connection
Because the current and voltage output of a PV panel is affected by changing weather conditions, it is important to characterize the response of the system to these changes so the equipment associated with the PV panel can be sized appropriately. The average operating voltage and current of a PV system is important to consider for safety concerns, equipment capabilities and choices, and minimizing the amount of wire required for construction. Using weather data, including historical temperature and solar irradiation information, engineers estimate how much energy a PV power plant might generate over its lifetime using the techniques described in this lesson.
Learning Objectives
After this lesson, students should be able to:
- Describe the effect that different temperatures have on the efficiency of PV panels.
- Explain how engineers might attempt to control the temperature of solar PV panels.
Educational Standards
Each TeachEngineering lesson or activity is correlated to one or more K-12 science,
technology, engineering or math (STEM) educational standards.
All 100,000+ K-12 STEM standards covered in TeachEngineering are collected, maintained and packaged by the Achievement Standards Network (ASN),
a project of D2L (www.achievementstandards.org).
In the ASN, standards are hierarchically structured: first by source; e.g., by state; within source by type; e.g., science or mathematics;
within type by subtype, then by grade, etc.
Each TeachEngineering lesson or activity is correlated to one or more K-12 science, technology, engineering or math (STEM) educational standards.
All 100,000+ K-12 STEM standards covered in TeachEngineering are collected, maintained and packaged by the Achievement Standards Network (ASN), a project of D2L (www.achievementstandards.org).
In the ASN, standards are hierarchically structured: first by source; e.g., by state; within source by type; e.g., science or mathematics; within type by subtype, then by grade, etc.
NGSS: Next Generation Science Standards - Science
| NGSS Performance Expectation | ||
|---|---|---|
|
HS-ESS3-4. Evaluate or refine a technological solution that reduces impacts of human activities on natural systems. (Grades 9 - 12) Do you agree with this alignment? |
||
| Click to view other curriculum aligned to this Performance Expectation | ||
| This lesson focuses on the following Three Dimensional Learning aspects of NGSS: | ||
| Science & Engineering Practices | Disciplinary Core Ideas | Crosscutting Concepts |
| Design or refine a solution to a complex real-world problem, based on scientific knowledge, student-generated sources of evidence, prioritized criteria, and tradeoff considerations. Alignment agreement: | Scientists and engineers can make major contributions by developing technologies that produce less pollution and waste and that preclude ecosystem degradation. Alignment agreement: When evaluating solutions it is important to take into account a range of constraints including cost, safety, reliability and aesthetics and to consider social, cultural and environmental impacts.Alignment agreement: | Feedback (negative or positive) can stabilize or destabilize a system. Alignment agreement: Engineers continuously modify these technological systems by applying scientific knowledge and engineering design practices to increase benefits while decreasing costs and risks.Alignment agreement: |
| NGSS Performance Expectation | ||
|---|---|---|
|
HS-PS3-3. Design, build, and refine a device that works within given constraints to convert one form of energy into another form of energy. (Grades 9 - 12) Do you agree with this alignment? |
||
| Click to view other curriculum aligned to this Performance Expectation | ||
| This lesson focuses on the following Three Dimensional Learning aspects of NGSS: | ||
| Science & Engineering Practices | Disciplinary Core Ideas | Crosscutting Concepts |
| Design, evaluate, and/or refine a solution to a complex real-world problem, based on scientific knowledge, student-generated sources of evidence, prioritized criteria, and tradeoff considerations. Alignment agreement: | At the macroscopic scale, energy manifests itself in multiple ways, such as in motion, sound, light, and thermal energy. Alignment agreement: Although energy cannot be destroyed, it can be converted to less useful forms—for example, to thermal energy in the surrounding environment.Alignment agreement: Criteria and constraints also include satisfying any requirements set by society, such as taking issues of risk mitigation into account, and they should be quantified to the extent possible and stated in such a way that one can tell if a given design meets them.Alignment agreement: | Energy cannot be created or destroyed—it only moves between one place and another place, between objects and/or fields, or between systems. Alignment agreement: Modern civilization depends on major technological systems. Engineers continuously modify these technological systems by applying scientific knowledge and engineering design practices to increase benefits while decreasing costs and risks.Alignment agreement: |
Common Core State Standards - Math
-
Interpret the parameters in a linear or exponential function in terms of a context.
(Grades
9 -
12)
More Details
Do you agree with this alignment?
-
Understand that the graph of an equation in two variables is the set of all its solutions plotted in the coordinate plane, often forming a curve (which could be a line).
(Grades
9 -
12)
More Details
Do you agree with this alignment?
International Technology and Engineering Educators Association - Technology
-
Energy resources can be renewable or nonrenewable.
(Grades
9 -
12)
More Details
Do you agree with this alignment?
-
Power systems must have a source of energy, a process, and loads.
(Grades
9 -
12)
More Details
Do you agree with this alignment?
State Standards
Colorado - Science
-
Use appropriate measurements, equations and graphs to gather, analyze, and interpret data on the quantity of energy in a system or an object
(Grades
9 -
12)
More Details
Do you agree with this alignment?
-
Evaluate the energy conversion efficiency of a variety of energy transformations
(Grades
9 -
12)
More Details
Do you agree with this alignment?
Worksheets and Attachments
Visit [www.teachengineering.org/lessons/view/cub_pveff_lesson02] to print or download.Introduction/Motivation
Have you ever noticed how an LCD display, such as your calculator or cell phone screen, changes color when exposed to extreme cold or hot temperatures? Temperature affects how electricity flows through an electrical circuit by changing the speed at which the electrons travel. This is due to an increase in resistance of the circuit that results from an increase in temperature. Likewise, resistance is decreased with decreasing temperatures.
Imagine going for a run in the desert when it is 110 ºF. Do you think your body would enjoy working hard under those conditions? Now, imagine that same run on a nice cool fall evening with a slight breeze. In which weather conditions would your body work the best? In the same way that a human body's abilities change depending on weather conditions, a solar panel's output depends on its working conditions.
Solar panels work best in certain weather conditions, but since the weather is always changing and as engineers are installing solar panels all over the world in different climate regions, most panels do not operate under ideal conditions. That is why it is important for engineers to understand how panels react to different weather conditions. With this knowledge, they can design ways to improve the efficiency of solar panels that operate in non-optimal conditions.
In some cases, they design cooling systems to keep the panels within certain temperatures. For example, solar power plants in extremely hot climates may pass a cool liquid behind the panels to pull away heat and keep the panels cool. This is similar to how your body might sweat as a way to stay cool if you were on that run in the 110 ºF air temperature. Following the lesson refer to the associated activity Photovoltaics & Temperature: Ice, Ice, PV! for students to examine how the power output of a PV solar panel is affected by temperature changes by exposing the panel temperature to various temperatures and recording the resulting voltage output.
Lesson Background and Concepts for Teachers
For each individual PV system, engineers must use specific equipment, such as inverters, to ensure that the system runs at maximum efficiency. Different inverters are rated for different maximum voltages and have higher efficiencies between different voltage ranges. Engineers must carefully size the PV system in different temperature environments to ensure that the output voltage is not too high, which could damage the equipment. A PV system in Arizona will have a maximum system voltage that is lower than the same system in North Dakota (built with the same materials) because of the higher temperatures in Arizona. Because PV panels are more efficient at lower temperatures, engineers also design systems with active and passive cooling. Cooling the PV panels allows them to function at a higher efficiency and produce more power.
Panels can be cooled actively or passively. An active system requires some external power source to run. A passive system is requires no added power. An example passive system might be an array of panels that are set off the roof 2 feet (61 cm) to allow air to naturally flow behind the panels and pull away some heat, or a white-colored roof that prevents the surfaces around the panels from heating up and causing additional heat gain. An active system might have fans to blow air over the panels, or pump water behind the panels to pull away heat. An active cooling system may be used in certain situations in which the added efficiency to the panels is greater than the energy needed to run the system, such as with a solar power plant in a desert. They also may be used in situations in which some additional purpose can be achieved, such as domestic water heating.
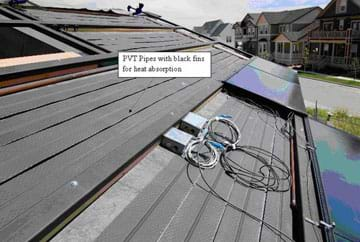
An example hybrid photovoltaic thermal (PVT) system is shown in Figure 1. This combined solar PV and water heating system was installed on the roof of a student-designed solar decathlon home. The system runs cool water behind the panels to absorb heat from them, making them more efficient. The heated water is used in the home for showers or heating. Even if the outside temperatures are cold, the dark panels and rooftop become quite hot on sunny days because of all the solar radiation received, making a PVT system a practical solution to increase electrical power production from the PV panels and reduce the heating loads in the home!
While it is important to know the temperature of a solar PV panel to predict its power output, it is also important to know the PV panel material because the efficiencies of different materials have varied levels of dependence on temperature. Therefore, a PV system must be engineered not only according to the maximum, minimum and average environmental temperatures at each location, but also with an understanding of the materials used in the PV panel. The temperature dependence of a material is described with a temperature coefficient. For polycrystalline PV panels, if the temperature decreases by one degree Celsius, the voltage increases by 0.12 V so the temperature coefficient is 0.12 V/C. The general equation for estimating the voltage of a given material at a given temperature is: 
VOC,mod = open circuit voltage at module temperature
TSTC [°C] = temperature at standard test conditions (STC), 25 °C, 1000 W/m2 solar irradiance
Tmod [°C] = module temperature
VOC,rated = open circuit voltage at STC
As an example, for polycrystalline, the equation is:
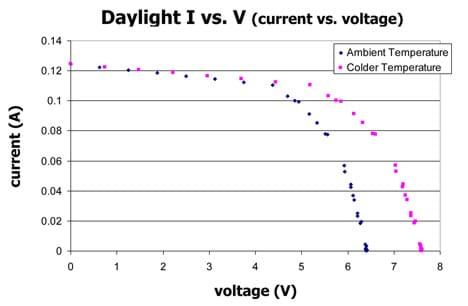
The effect of temperature can be clearly displayed by a PV panel I-V (current vs. voltage) curve. I-V curves show the different combinations of voltage and current that can be produced by a given PV panel under the existing conditions. Two sample I-V curves at different temperatures for the educational modules are shown in Figure 2. The current, measured in amps (A), is given on the y-axis. The voltage, measured in volts (V), is given on the x-axis. To gather data for this graph, a PV panel was placed flat on the ground in Boulder, CO, at 40° latitude on December 11. The first measurements were taken in ambient temperature conditions, and then they were taken again after the panel was cooled in an ice bath for one minute. 
Associated Activities
- Photovoltaics & Temperature: Ice, Ice, PV! - Students examine how the power output of a PV solar panel is affected by temperature changes by exposing the panel temperature to various temperatures and recording the resulting voltage output. They plot the power output and calculate the panel's temperature coefficient.
Lesson Closure
Today we learned that temperature can affect how electricity flows through an electrical circuit by changing the speed at which the electrons travel. Also, since solar panels work best at certain weather and temperature conditions, engineers design ways to improve the efficiency of solar panels that operate in non-optimal temperature conditions. This might involve designing cooling systems that use outside air, fans and pumps.
Now that we know the effects of temperature on the power output of PV panels, what do you think would be an ideal climate in which to set up a large PV system? (Answer: A cold and sunny climate.) Do you think there are many places in the world like this? If you look up maps on Google images of world temperatures and world solar radiation availability, you will find that most locations are not ideal for solar PV panels. This means engineers have many opportunities to design innovative systems to keep panels cool as solar power plants become more common, because the ideal cool and sunny climate is rare.
Vocabulary/Definitions
active cooling: Using forced water or air to cool the surface of PV panels in order to improve their efficiency.
ambient: Surrounding environmental conditions.
inverter: An electrical device that converts the DC current produced by the PV panel to an AC current used by electrical devices. Inverters can also be used for maximum power point tracking to maximize the efficiency of the PV panel.
open circuit voltage: Voltage available from a power source in an open circuit.
photovoltaic thermal system: An active cooling system in which cool water is used to decrease the temperature of the PV panel while warming the water to be used in hot water applications.
short circuit current: Current drawn from a power source if no load is present in the circuit.
temperature coefficient: Number [V/°C] that one would use to find the open circuit voltage of a PV panel at a temperature other than standard test temperature.
Assessment
Pre-Lesson Assessment
Discussion Questions: Ask the students the following question, and discuss as a class:
- What effect do you think temperature has on how well a photovoltaic (PV) panel works?
Post-Introduction Assessment
Class Discussion: Have students read the Fundamentals Article and engage the class in a discussion of what they have read. On a sheet of paper or in a journal, ask each student or group to record five facts they learned from the article. Have each student or group write one of these facts on the board to be discussed with the entire class.
- As a class, ask students to interpret the graph on page 3 of the Fundamentals Article. (Answer: The resulting graph clearly shows that when the panel is at a colder temperature and a higher voltage, then a higher power output is achieved.)
Lesson Summary Assessment
List & Discuss: From their reading of the Fundamentals Article, ask students to list on paper 10 applications for which solar panels could be used. Next to each application, write the temperature(s) to which the panel might be exposed. Then share answers and discuss as a class. (Example answers: 1. Solar plant in a desert to power a nearby city: very hot, 100 °F or higher; 2. Provide light and power to a research station in Antarctica: very cold, below 0 °F.)
Lesson Extension Activities
Graphing: Given a temperature coefficient and a VOC, rated, ask students to create a graph of output voltage vs. temperature for the yearly temperature range found in their home town.
Subscribe
Get the inside scoop on all things Teach Engineering such as new site features, curriculum updates, video releases, and more by signing up for our newsletter!More Curriculum Like This

Students learn how to find the maximum power point (MPP) of a photovoltaic (PV) panel in order to optimize its efficiency at creating solar power. They also learn about real-world applications and technologies that use this technique, as well as Ohm's law and the power equation, which govern a PV pa...

Students learn about the daily and annual cycles of solar angles used in power calculations to maximize photovoltaic power generation. They gain an overview of solar tracking systems that improve PV panel efficiency by following the sun through the sky.

Students examine how the power output of a photovoltaic (PV) solar panel is affected by temperature changes. Using a 100-watt lamp and a small PV panel connected to a digital multimeter, teams vary the temperature of the panel and record the resulting voltage output.

Students learn how the total solar irradiance hitting a photovoltaic (PV) panel can be increased through the use of a concentrating device, such as a reflector or lens.
References
Green Power Hits the Slopes. Published December 2007. EERE-PMC News, US Department of Energy. Accessed March 10, 2010. https://www.eere-pmc.energy.gov/PMC_News/PMC_News_12-07.aspx
Solar Decathlon. US Department of Energy. Accessed March 10, 2010. (In the Solar Decathlon, 20 international college and university teams compete to design, build and operate the most attractive and energy-efficient solar-powered house.) http://www.solardecathlon.org/
Copyright
© 2009 by Regents of the University of Colorado.Contributors
William Surles, Jack Baum, Abigail Watrous, Stephen Johnson, Eszter Horanyi, Malinda Schaefer Zarske (This high school curriculum was originally created as a class project by engineering students in a Building Systems Program course at CU-Boulder.)Supporting Program
Integrated Teaching and Learning Program, College of Engineering and Applied Science, University of Colorado BoulderLast modified: July 2, 2019


User Comments & Tips