Summary
This hands-on experiment provides students with an understanding of the issues that surround environmental cleanup. Student teams create their own oil spills, try different methods for cleaning them up, and then discuss the merits of each method in terms of effectiveness (cleanliness) and cost. They are asked to put themselves in the place of both environmental engineers and oil company owners who are responsible for the cleanup.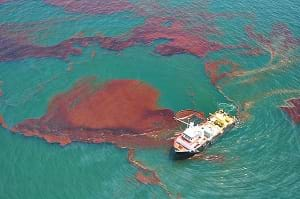
Engineering Connection
Environmental engineers are called upon to assist with the cleanup of oil spills and other environmental hazards. They must be familiar with different cleanup methods and then effectively communicate these strategies with the community, the cleanup crew and the company/person responsible for the spill. Environmental engineers' contributions to environmental cleanup are important in keeping our Earth's water and land healthy for plans and animals.
Learning Objectives
After this activity, students should be able to:
- Identify some causes and effects of oil spills on a water source and the organisms that use that water.
- Describe the different methods that environmental engineers use to clean up water pollution.
- Use volume to describe the amount of oil and water removed during the model cleanup.
- Organize their oil removal data and analyze using a bar graph.
Educational Standards
Each Teach Engineering lesson or activity is correlated to one or more K-12 science,
technology, engineering or math (STEM) educational standards.
All 100,000+ K-12 STEM standards covered in Teach Engineering are collected, maintained and packaged by the Achievement Standards Network (ASN),
a project of D2L (www.achievementstandards.org).
In the ASN, standards are hierarchically structured: first by source; e.g., by state; within source by type; e.g., science or mathematics;
within type by subtype, then by grade, etc.
Each Teach Engineering lesson or activity is correlated to one or more K-12 science, technology, engineering or math (STEM) educational standards.
All 100,000+ K-12 STEM standards covered in Teach Engineering are collected, maintained and packaged by the Achievement Standards Network (ASN), a project of D2L (www.achievementstandards.org).
In the ASN, standards are hierarchically structured: first by source; e.g., by state; within source by type; e.g., science or mathematics; within type by subtype, then by grade, etc.
NGSS: Next Generation Science Standards - Science
| NGSS Performance Expectation | ||
|---|---|---|
|
MS-ESS3-3. Apply scientific principles to design a method for monitoring and minimizing a human impact on the environment. (Grades 6 - 8) Do you agree with this alignment? |
||
| Click to view other curriculum aligned to this Performance Expectation | ||
| This activity focuses on the following Three Dimensional Learning aspects of NGSS: | ||
| Science & Engineering Practices | Disciplinary Core Ideas | Crosscutting Concepts |
| Apply scientific principles to design an object, tool, process or system. Alignment agreement: | Human activities have significantly altered the biosphere, sometimes damaging or destroying natural habitats and causing the extinction of other species. But changes to Earth's environments can have different impacts (negative and positive) for different living things. Alignment agreement: | Relationships can be classified as causal or correlational, and correlation does not necessarily imply causation. Alignment agreement: The uses of technologies and any limitations on their use are driven by individual or societal needs, desires, and values; by the findings of scientific research; and by differences in such factors as climate, natural resources, and economic conditions. Thus technology use varies from region to region and over time.Alignment agreement: |
| NGSS Performance Expectation | ||
|---|---|---|
|
MS-ETS1-2. Evaluate competing design solutions using a systematic process to determine how well they meet the criteria and constraints of the problem. (Grades 6 - 8) Do you agree with this alignment? |
||
| Click to view other curriculum aligned to this Performance Expectation | ||
| This activity focuses on the following Three Dimensional Learning aspects of NGSS: | ||
| Science & Engineering Practices | Disciplinary Core Ideas | Crosscutting Concepts |
| Evaluate competing design solutions based on jointly developed and agreed-upon design criteria. Alignment agreement: | There are systematic processes for evaluating solutions with respect to how well they meet the criteria and constraints of a problem. Alignment agreement: | |
| NGSS Performance Expectation | ||
|---|---|---|
|
MS-ETS1-3. Analyze data from tests to determine similarities and differences among several design solutions to identify the best characteristics of each that can be combined into a new solution to better meet the criteria for success. (Grades 6 - 8) Do you agree with this alignment? |
||
| Click to view other curriculum aligned to this Performance Expectation | ||
| This activity focuses on the following Three Dimensional Learning aspects of NGSS: | ||
| Science & Engineering Practices | Disciplinary Core Ideas | Crosscutting Concepts |
| Analyze and interpret data to determine similarities and differences in findings. Alignment agreement: | There are systematic processes for evaluating solutions with respect to how well they meet the criteria and constraints of a problem. Alignment agreement: Sometimes parts of different solutions can be combined to create a solution that is better than any of its predecessors.Alignment agreement: Although one design may not perform the best across all tests, identifying the characteristics of the design that performed the best in each test can provide useful information for the redesign process—that is, some of the characteristics may be incorporated into the new design.Alignment agreement: | |
Common Core State Standards - Math
-
Find a percent of a quantity as a rate per 100 (e.g., 30% of a quantity means 30/100 times the quantity); solve problems involving finding the whole, given a part and the percent.
(Grade
6)
More Details
Do you agree with this alignment?
-
Display numerical data in plots on a number line, including dot plots, histograms, and box plots.
(Grade
6)
More Details
Do you agree with this alignment?
-
Use ratio and rate reasoning to solve real-world and mathematical problems, e.g., by reasoning about tables of equivalent ratios, tape diagrams, double number line diagrams, or equations.
(Grade
6)
More Details
Do you agree with this alignment?
International Technology and Engineering Educators Association - Technology
-
The management of waste produced by technological systems is an important societal issue.
(Grades
6 -
8)
More Details
Do you agree with this alignment?
-
Analyze how the creation and use of technologies consumes renewable and non-renewable resources and creates waste.
(Grades
6 -
8)
More Details
Do you agree with this alignment?
-
Devise strategies for reducing, reusing, and recycling waste caused from the creation and use of technology.
(Grades
6 -
8)
More Details
Do you agree with this alignment?
State Standards
Colorado - Math
-
Display numerical data in plots on a number line, including dot plots, histograms, and box plots.
(Grade
6)
More Details
Do you agree with this alignment?
-
Use ratio and rate reasoning to solve real-world and mathematical problems.
(Grade
6)
More Details
Do you agree with this alignment?
-
Find a percent of a quantity as a rate per 100.
(Grade
6)
More Details
Do you agree with this alignment?
Colorado - Science
-
Identify problems, and propose solutions related to water quality, circulation, and distribution – both locally and worldwide
(Grade
6)
More Details
Do you agree with this alignment?
Materials List
Each group needs:
- 1 aluminum pie pan
- 1 large stone that fills ~20% of the pie pan; ask students to bring from home during the two weeks leading up to class
- 2 bird feathers, available from hobby shops
- 1 plastic spoon, for skimming oil from the pie pan
- 1 small graduated cylinder, ~20 ml, for placing spoonfuls of skimmed oil/water
- 1 small funnel, for adding skimmed oil/water to test tubes
- 4 oil absorbing cloth pads, for absorbing oil; either cut a big sheet into smaller squares or use cotton balls/pads
- 1 small squeeze bottle of "grease-fighting" dishwashing detergent labeled "dispersant", such as Dawn®
- Oil Spill Worksheet, one per student
For the entire class to share:
- pitchers/jugs of water
- ~100 ml dark vegetable oil in a plastic squeeze bottle; if necessary, oil can be dyed with liquid food coloring
- plenty of paper towels
- 1 large garbage bag, for cleanup
Worksheets and Attachments
Visit [www.teachengineering.org/activities/view/cub_enveng_lesson01_activity1] to print or download.Pre-Req Knowledge
For the activity worksheet, students should be familiar with creating bar graphs.
Introduction/Motivation
The Exxon Valdez oil spill was one of the largest oil spills in recorded history. It took four summers to clean up the spill. Why is it so hard to clean up oil? Why does it take so long? One reason is because of its low density, which causes oil to float on top of water. In addition, oil is hydrophobic (afraid of water) so it does not like to be in water. Oil is more likely to stick to anything other than water; which explains how it pollutes animals, beaches and rocks rather than mixes with water.
In some cases, people rely on the environment's ability to dilute pollutants. For example, car exhaust is very toxic, but we depend on the environment's ability to mix the exhaust with the air in the atmosphere. Although it is not the best method of dealing with pollution, diluting the exhaust in the air actually reduces its toxicity. We are not harmed (that is, poisoned) by carbon monoxide while walking alongside a car, but we would be if we sat in a closed garage with the car running. The ocean works in the same way as the atmosphere. Some wastes are unavoidably disposed of in the ocean. Runoff from populated areas, highways and chemical-laden fields contains various types of pollution, and it all ends up in the ocean at some point. The ocean can dilute the runoff to a certain extent—resulting in no immediate threat to inhabitants. Because of its hydrophobic properties, however, oil will never easily dilute into the ocean, which makes it very hard and time-consuming to clean up spills.
Oil spills, like most environmental issues, become contentious political situations. Many questions are asked, and blame is given. Who is responsible for the pollution? Who should pay for the cleanup? How much should they pay? How should the spill be cleaned up? These and other questions are often highly-debated issues. For example, most oil companies argue that the least expensive clean-up option should be used; whereas environmentalist and people impacted by oil spills want the method that works the best—no matter the cost. In the case of the Exxon Valdez oil spill, Exxon paid a tremendous amount of money for the initial cleanup, although a lot of oil still remains in and around Prince William Sound. Although Exxon has already paid $1.1 billion in punitive damages to many of the local people who were negatively affected by the spill, they are still being sued for more. Another example of how complicated environmental issues can become is that even decades after the spill occurred, lawyers are still debating how much money to pay the 32,000 fisherman who were out of work because of the Exxon Valdez oil spill.
Today, we are going to create a model of an oil spill. You are going to play the role of environmental engineers and use different technologies to clean oil from water. You will use booms and skimmers (used to contain the oil and avoid spreading); absorbents (used to soak up the oil and avoid spreading); and dispersants (chemicals used to break down the oil). You will collect data on oil removal and then look the cleanup methods used from the viewpoint of both the environmental engineer and the oil company owner. How do you think they will feel about the oil spill cleanup?
Procedure
Before the Activity
- Gather materials and make copies of the student worksheet.
- To give give students enough time to experiment with oil remediation methods, separate materials for each team into bins or bags, ready to hand out.
With the Students: First Class Period
- Introduce the topic of environmental engineering. Talk about the different tasks for which environmental engineers are responsible: biotechnology, water treatment, wastewater treatment, hazardous waste management, landfill construction, etc. Mention that today, we will focus on an environmental problem that involves environmental engineers.
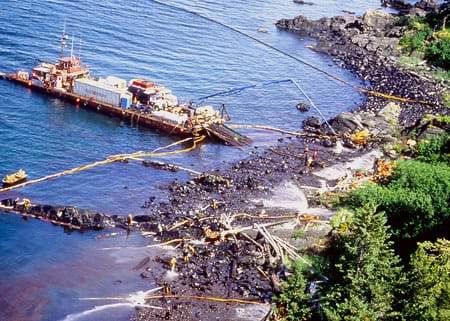
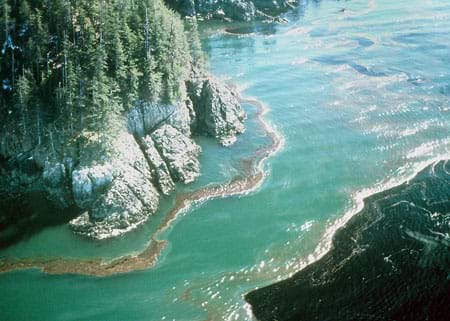
- Present the Introduction/Motivation section content. Ask students if they have ever heard of any oil spills, such as the Exxon Valdez. Talk about the significance of the oil spill, how much oil was released and the impact it had on the environment. (Note: If possible, print Figures 1 and 2 to show students the effects of the oil spill on the surrounding beach/land).
- Discuss both the environmental engineer and the oil company owner positions with regard to the cost of cleanup. When is clean really clean and when is expensive really expensive? (For this activity, owners desire the most effective cleanup for a reasonable cost while environmental engineers desire the most effective cleanup regardless of cost.)
- Ask students to brainstorm different methods for cleaning up an oil spill. Write their suggestions on the classroom board, reminding them that all suggestions are good and worth sharing. Have them discuss if the suggested methods are really good (effective) at cleaning up spills and how expensive they think each idea might be.
- After brainstorming, discuss the methods that they will be using today to clean up the oil spill: 1) skimming, because oil floats, 2) absorbing it onto pads that specifically absorb oil, and 3) adding a dispersant to break up the oil "slick" surface into little droplets.
- Ask them to form a hypothesis regarding which method they believe will be the best for cleanup and why and write it on their worksheets.
- Model setup: Have student pairs set up their oil spill pans. Have them place the pan on the table and put the stone in the middle of the pan. Add water to the pie pan until about half full. Tell students: In this model oil spill, the stone represents the land and the water represents the ocean. One objectives for your cleanup effort is to keep the oil away from the land.
- Begin testing: Have them place a small amount (~1 tablespoon) of oil (dark-colored vegetable oil) in the pie pan. What happens? Have them watch closely to see if the oil moves toward the land.
- Have them place a feather in the oily water. After 30 seconds or so, remove the feather and examine what the oil has done to it. What impact can they conclude that oil has on birds?
- Have them use the skimmer (spoon) to try and remove the oil, pouring into a graduated cylinder. (Note: Demonstrate how to use the spoon to gently skim off the top layer of oil without removing spoonfuls of water). Ask them to determine approximately what percentage of oil and what percentage of water they removed? Record their measurment number on their worksheets. (Note: Obtain the number from the graduated cylinder since the oil and water will separate in the cylinder.)
- Have them place a score (H = high, M = medium, L = low) on their worksheets for the cost and effectiveness of skimming if they were either the environmental engineer or the oil company owner.
- Next, have them use the absorbent cloth to absorb the oil. Ask them if they think the cloth is expensive? How well did it work?
- On their worksheets, have them rate the cloth in terms of effectiveness (H, M, L) and cost (high cost, medium cost, low cost) if they were either the environmental engineer or the oil company owner.
- Lastly, have them place 1 or 2 drops of "dispersant" into the pie pan and stir it around with a spoon. Expect them to notice that the oil appears to break up into small droplets. Is this an effective means for cleanup?
- Have them use dispersant on the feathers to see what effect the oil now has on them. Expect the feathers to be fine; the dispersant worked!
- Have them rate the dispersant in terms of cost and effectiveness if they were either the environmental engineer or the oil company owner.
- Cleanup time: Clean the rocks with soap and water. Clean up the surface areas with paper towels. Place the water, vegetable oil and dispersant from the pie pans and test tubes down the drain. Place pie pans in garbage bags. Return any cleaned reusable supplies to a common area.
With the Students: Second Class Period
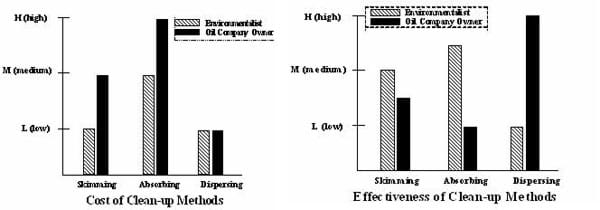
- Students continue to complete the worksheets. Ask them to make two vertical bar charts on their worksheets showing the relationship between low, medium and high effectiveness (one of the bar charts) for each cleanup method and cost (the other bar chart) if they were an environmental engineer or an oil company owner. Refer to Figure 3 for an example of each.
- Have students discuss their answers with a partner. Let them know that they need to be able to defend their answers.
- Take a Stand! Ask students to take a stand on the following statements. Have them line up in one of five rows based on whether they agree strongly, mildly, neutral (don't know if they agree or not), disagree mildly or disagree strongly with the following statements. (Note: Hang signs on the wall matching the possible responses, so students do not get confused as to which line is which.) Randomly call on certain students to explain their point-of-view and logic.
- Take a Stand! "I think there was a high degree of effectiveness and low cost in cleaning up the oil spill using skimming." After they take a stand (that is, form in rows), discuss the impact of the ocean waves and how this would make skimming that much more difficult to carry out. Talk about how much water they picked up with their spoons and how effective this method really was. Talk about the cost of boats that perform skimming procedures.
- Take a Stand! "I think there was a high degree of effectiveness and low cost in cleaning up the oil spill using absorbent cloth." While the cloth worked well, mention the environmental impact of cleaning up or disposing of the cloth. Have they only added to the cleanup? This method may work nice in a pie pan, but how effective is this method in an enormous ocean oil spill? Also, is this cloth expensive to buy?
- Take a Stand! "I think there was a high degree of effectiveness and low cost in cleaning up the oil spill using dispersants." Important: Ask them where the oil went. Ask them if the water is really clean or not so clean? Point out the issues of putting more chemicals in the water and if this is appropriate or not. Discuss with them the fact that the ocean waves might mix the dispersant. How might the dispersant affect animals and organisms in the water? Is the dispersant a pollutant that upsets the ecosystem balance?
- Collect the completed worksheets. Then, summarize the experiment. Be sure to talk about the various perspectives that were presented, based upon the environmental engineer or oil company owner point-of-views. Reflect on the bar charts as one possible scenario, but explain that different people would have different answers.
Assessment
Pre-Activity Assessment
Brainstorming: Ask students to brainstorm different methods for cleaning up oil spills. Write their suggestions on the classroom board, reminding them that all suggestions are worth sharing during brainstorming. Have them discuss whether the suggested methods are really good (effective) at cleaning up spills and how expensive they think each idea might be.
Activity Embedded Assessment
Worksheet: Have students complete the Oil Spill Worksheet during the course of the activity. Verify that students are using the different materials to collect their "oil spill" by walking around the classroom and asking them which part of the procedure they are working on. Review their answers to gauge their mastery of the subject.
Post-Activity Assessment
Prediction Analysis: Have students compare their initial predictions with their test results, as recorded on the Oil Spill Worksheet. Ask students to explain how effective each methods was. Analyze the data from each test to determine similarities and differences among each design solution. Identify the best characteristics of each that can be combined into a new solution.
Problem Solving: Have students engage in open discussion to suggest solutions to the following problem:
- After trying to contain, clean, dissolve, or remove the oil spill with the various utensils and "chemicals," you never reached a pristine environment. As environmental engineers, how would you approach the cleanup of a major or minor oil spill in a local water resource? Which, if any, of the cleanup technologies would you use? Would you use more than one?
Persuasion Paper/Oral Defense: In a short paper or oral defense, assign students to explain the jobs environmental engineers perform, sources of pollution, and why pollution is harmful for the environment.
Making Sense: Have students reflect about the science phenomena they explored and/or the science and engineering skills they used by completing the Making Sense Assessment.
Troubleshooting Tips
This activity can be very messy. Make sure to have plenty of paper towels for cleanup! All materials in this activity can be disposed of in the garbage or down the drain.
Activity Extensions
Cleaning Oily Feathers Experiment: In this experiment, students look at the way oil affects bird feathers and try out different cleanup methods to find out which works best. http://response.restoration.noaa.gov/training-and-education/education-students-and-teachers/find-best-way-clean-oil-bird-feathers.html
Graphing Changes in Marine Life Abundance Activity: This study uses the same methods used by real marine biologists. http://oceanservice.noaa.gov/education/stories/oilymess/working.html
Activity Scaling
For lower grades, focus on the bar graphs. Have the students present their graphs. If time permits, have them add pictures for support.
For higher grades, add extra math support by having students create graphs that compare the effectiveness (y-axis) vs. cleanup method (x-axis). Then have them create another graph that compares effectiveness vs. costs of different cleanup methods. Have them explain/support their answers with a persuasive paragraph. Or, have student groups develop an action plan for an area of the coast where an oil tanker has had a major spill. What should the community do? Local government do? Local engineers do? Have students use their graphs to support a proposal made by the local government to the community.
Subscribe
Get the inside scoop on all things Teach Engineering such as new site features, curriculum updates, video releases, and more by signing up for our newsletter!More Curriculum Like This

Students explore an important role of environmental engineers—cleaning the environment. They learn details about the Exxon Valdez oil spill, which was one of the most publicized and studied human-caused environmental tragedies in history.

Students learn about oil spills and their environmental and economic impact. They experience the steps of the engineering design process, starting by brainstorming ways to clean up oil spills, and then designing, building and re-designing oil booms to prevent the spread of oil on water. During a con...

Through the use of models and scientific investigation, students explore the causes of water pollution and its effects on the environment. Through the two associated activities, they investigate filtration and aeration processes that are used for removing pollutants from water.

Students learn about a special branch of engineering called bioremediation, which is the use of living organisms to aid in the clean-up of pollutant spills. Students learn all about bioremediation and see examples of its importance. In the associated activity, students conduct an experiment and see ...
References
"Exxon plans quick appeal in Valdez case: Judge awards $4.5 billion in damages." Published January 29, 2004. Colombia Daily Tribune. Accessed January 29, 2004. http://www.showmenews.com/2004/Jan/20040129Busi006.asp
Exxon Valdez Oil Spill Trustee Council http://www.evostc.state.ak.us/
FAQS and History. Office of Response and Restoration, National Ocean Service, National Oceanic and Atmospheric Administration http://response.restoration.noaa.gov/faqs/history.html and http://response.restoration.noaa.gov/
Copyright
© 2004 by Regents of the University of ColoradoContributors
Sharon D. Perez-Suarez; Melissa Straten; Malinda Schaefer Zarske; Janet YowellSupporting Program
Integrated Teaching and Learning Program, College of Engineering, University of Colorado BoulderAcknowledgements
The contents of this digital library curriculum were developed under grants from the Fund for the Improvement of Postsecondary Education (FIPSE), U.S. Department of Education and National Science Foundation (GK-12 grant no. 0338326). However, these contents do not necessarily represent the policies of the Department of Education or National Science Foundation, and you should not assume endorsement by the federal government.
Last modified: October 20, 2020





User Comments & Tips