
Light Intensity Lab
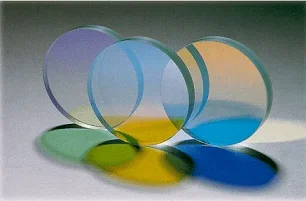 An ultraviolet interference filter created by transparent materials.Copyright 2007 Barr Associates, Jet Propulsion Laboratory, NASA, Wikimedia Commons http://commons.wikimedia.org/wiki/File:Dichroic_filters.jpg
Students complete this Beer's law activity in class by examining the attenuation of various thicknesses of transparencies. From this activity, they come to understand that different substances absorb light differently. This concept is transferred to x-rays to explain that different substances absorb x-rays differently, hence the need for dual-energy analysis. In looking at Beer's law, students use the properties associated with natural logarithms. To conclude the activity, students complete a series of questions and calculations.
Light attenuation and Beer's law are concepts that are very important to many engineers. Environmental engineers must understand these concepts when designing solar panels as a means of alternative energy. Biomedical engineers apply these concepts to bone mineral density measurements using x-ray machines, as well as other broader applications such as the design of biomaterials.
After this activity, students should be able to:
- Derive the relationship between light and number of layer of attenuation.
- Perform experiments to illustrate the concept of attenuation.
- CCSS.Math.Content.HSA-SSE.B.3 Choose and produce an equivalent form of an expression to reveal and explain properties of the quantity represented by the expression.
Grades 9-12
Do you agree with this alignment? - CCSS.Math.Content.HSF-BF.B.5 (+) Understand the inverse relationship between exponents and logarithms and use this relationship to solve problems involving logarithms and exponents.
Grades 9-12
Do you agree with this alignment? - CCSS.Math.Content.HSF-LE.A.4 For exponential models, express as a logarithm the solution to abct = d where a, c, and d are numbers and the base b is 2, 10, or e; evaluate the logarithm using technology.
Grades 9-12
Do you agree with this alignment? - CCSS.Math.Content.HSS-ID.B.6b Informally assess the fit of a function by plotting and analyzing residuals.
Grades 9-12
Do you agree with this alignment? - CCSS.Math.Content.HSS-ID.C.8 Compute (using technology) and interpret the correlation coefficient of a linear fit.
Grades 9-12
Do you agree with this alignment?
- Telemedicine reflects the convergence of technological advances in a number of fields, including medicine, telecommunications, virtual presence, computer engineering, informatics, artificial intelligence, robotics, materials science, and perceptual psychology.
Grades 9-12
Do you agree with this alignment? - STEL-3H Analyze how technology transfer occurs when a user applies an existing innovation developed for one function to a different purpose.
Grades 9-12
Do you agree with this alignment?
- HS-PS4-5 Communicate technical information about how some technological devices use the principles of wave behavior and wave interactions with matter to transmit and capture information and energy.
Grades 9-12
This resource focuses on the following Three Dimensional Learning aspects of NGSS:
Science & Engineering Practices- Communicate technical information or ideas (e.g. about phenomena and/or the process of development and the design and performance of a proposed process or system) in multiple formats (including orally, graphically, textually, and mathematically).Do you agree with this alignment?
Disciplinary Core Ideas- Solar cells are human-made devices that likewise capture the sun's energy and produce electrical energy.Do you agree with this alignment?
- Information can be digitized (e.g., a picture stored as the values of an array of pixels); in this form, it can be stored reliably in computer memory and sent over long distances as a series of wave pulses.Do you agree with this alignment?
- Photoelectric materials emit electrons when they absorb light of a high-enough frequency.Do you agree with this alignment?
- Multiple technologies based on the understanding of waves and their interactions with matter are part of everyday experiences in the modern world (e.g., medical imaging, communications, scanners) and in scientific research. They are essential tools for producing, transmitting, and capturing signals and for storing and interpreting the information contained in them.Do you agree with this alignment?
Crosscutting Concepts- Systems can be designed to cause a desired effect.Do you agree with this alignment?
- Modern civilization depends on major technological systems.Do you agree with this alignment?
- Science and engineering complement each other in the cycle known as research and development (R&D).Do you agree with this alignment?
Do you agree with this alignment? - Communicate technical information or ideas (e.g. about phenomena and/or the process of development and the design and performance of a proposed process or system) in multiple formats (including orally, graphically, textually, and mathematically).
- A2.A.SSE.B.2 Choose and produce an equivalent form of an expression to reveal and explain properties of the quantity represented by the expression.
Grades 9-12
Do you agree with this alignment? - A2.F.LE.A.2 For exponential models, express as a logarithm the solution to abct = d where a, c, and d are numbers and the base b is 2, 10, or e; evaluate the logarithm using technology.
Grades 9-12
Do you agree with this alignment? - CCSS.Math.Content.HSF-BF.B.5 (+) Understand the inverse relationship between exponents and logarithms and use this relationship to solve problems involving logarithms and exponents.
Grades 9-12
Do you agree with this alignment? - M1.S.ID.C.6 Compute (using technology) and interpret the correlation coefficient of a linear fit.
Grades 9-12
Do you agree with this alignment? - P.S.MD.A.2 Determine a regression equation to model a set of bivariate data. Justify why this equation best fits the data.
Grades 9-12
Do you agree with this alignment?
- Scientific Research
Grades 9-12
Do you agree with this alignment?
Each group needs:
- lamp
- incandescent 60 W bulb (not a halogen lamp)
- aluminum foil, ~12 x 12 inch piece
- clean transparencies
- Light Attenuation Scale (PDF); individually print this light intensity scale because it loses the grayscale detail when photocopied
- masking tape, ~12 inches
- scissors
- access to Microsoft Excel® computer software or a graphing calculator
- Light Experiment Worksheet (PDF)
Students should be familiar with either Microsoft Excel® or the use of graphing calculators.
Now that you have been introduced to the equation used to calculate intensity and completed a few practice problems, you are ready to use it in a real-world application.
Today we will complete a lab dealing with measuring light intensity through different numbers of sheets of transparencies.
I am passing out the worksheet now. Please get into groups of three and I will explain further once everyone has all the materials.
Background
- Each group needs to be able to work at a table near a wall to shine the lamp onto and take intensity measurements.
- Experiments must be performed with classroom lights out and shades drawn.
- See additional comments on the Light Experiment Worksheet Answer Key (PDF).
Before the Activity
- Make copies of the Light Experiment Worksheet (PDF).
- Print out enough Light Attenuation Scales (PDF), one per group.
- Set materials out at each workstation.
With the Students
- Tape the light intensity scale to a wall and set up the lamp to shine on the scale (do not turn on the lamp yet).
- Cut a plastic transparency sheet into eight equal-sized sections.
- Cut a 5 mm-diameter hole in the center of a piece of foil.
- Cover the face of the lamp by wrapping the foil around it, making sure that the hole is in the center of the face of the lamp and that the foil does not cover up any vents in the back of the lamp.
- Darken the room, turn on the lamp apparatus, and hold a piece of plastic transparency a few inches from the wall to cast a shadow near the scale (but not on the scale).
- Match the intensity of the resulting shadow with a square on the scale, as shown in Figure 1. Tip: It is easier to distinguish the shade of gray in the shadow by stepping back to look at it.
- Record the intensity in worksheet Table 1.
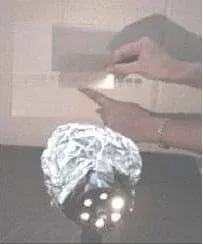 Figure 1. Comparing the shadow to the grayscale and collecting the data.Copyright 2001-2004 VaNTH ERC
- Repeat the process with two sheets of the transparency stacked together, then three, and so on until the table is filled.
- Next, use Excel to plot the natural logarithm of the shadow's intensity versus the thickness of the attenuator.
Post-Activity Assessment: Collect and grade students' completed Light Experiment Worksheets (PDF). Review their answers and calculations to assess their depth of comprehension.
Do not leave the lamp on for more than a minute at a time; the foil traps heat and can cause the bulb to burst.
Contributors
Cynthia Paschal; Stacy Klein; Sean Brophy; Chris Garay; Hunt McKelvey; Stephen Schleicher; Rachael Shevin; Rebecca Zambon; Kristyn Shaffer; Megan Johnston
Supporting Program
VU Bioengineering RET Program, School of Engineering, Vanderbilt University
Acknowledgements
The contents of this digital library curriculum were developed under National Science Foundation RET grant nos. 0338092 and 0742871. However, these contents do not necessarily represent the policies of the NSF, and you should not assume endorsement by the federal government.
Copyright
2013 by Regents of the University of Colorado; original © 2004 Vanderbilt University