Summary
Students learn about seismology by using a sample seismograph constructed out of common classroom materials. The seismograph creates a seismogram based on vibrations caused by moving a ruler. The students work in groups to represent an engineering firm that must analyze the seismograph for how it works and how to read the seismogram it creates.Engineering Connection
Engineers often invent new machines to use as measurement tools. To protect people from the potential devastation caused by earthquakes, engineers designed special machines that can sense seismic waves given off from an earthquake, causing a needle to vibrate back and forth over a piece of paper, creating a seismograph. From seismographs, engineers and scientists determine the strength or magnitude of an earthquake, from which they can make predictions.
Learning Objectives
After this activity, students should be able to:
- Understand how a seismograph works to measure the magnitude of an earthquake.
- Understand how and why engineers use a seismograph.
- Discuss methods to improve and re-engineer the model seismograph.
- Describe how a seismogram can help a community.
Educational Standards
Each TeachEngineering lesson or activity is correlated to one or more K-12 science,
technology, engineering or math (STEM) educational standards.
All 100,000+ K-12 STEM standards covered in TeachEngineering are collected, maintained and packaged by the Achievement Standards Network (ASN),
a project of D2L (www.achievementstandards.org).
In the ASN, standards are hierarchically structured: first by source; e.g., by state; within source by type; e.g., science or mathematics;
within type by subtype, then by grade, etc.
Each TeachEngineering lesson or activity is correlated to one or more K-12 science, technology, engineering or math (STEM) educational standards.
All 100,000+ K-12 STEM standards covered in TeachEngineering are collected, maintained and packaged by the Achievement Standards Network (ASN), a project of D2L (www.achievementstandards.org).
In the ASN, standards are hierarchically structured: first by source; e.g., by state; within source by type; e.g., science or mathematics; within type by subtype, then by grade, etc.
NGSS: Next Generation Science Standards - Science
| NGSS Performance Expectation | ||
|---|---|---|
|
MS-ESS3-2. Analyze and interpret data on natural hazards to forecast future catastrophic events and inform the development of technologies to mitigate their effects. (Grades 6 - 8) Do you agree with this alignment? |
||
| Click to view other curriculum aligned to this Performance Expectation | ||
| This activity focuses on the following Three Dimensional Learning aspects of NGSS: | ||
| Science & Engineering Practices | Disciplinary Core Ideas | Crosscutting Concepts |
| Construct an oral and written argument supported by empirical evidence and scientific reasoning to support or refute an explanation or a model for a phenomenon or a solution to a problem. Alignment agreement: | Mapping the history of natural hazards in a region, combined with an understanding of related geologic forces can help forecast the locations and likelihoods of future events. Alignment agreement: | Graphs, charts, and images can be used to identify patterns in data. Alignment agreement: The uses of technologies and any limitations on their use are driven by individual or societal needs, desires, and values; by the findings of scientific research; and by differences in such factors as climate, natural resources, and economic conditions. Thus technology use varies from region to region and over time.Alignment agreement: |
| NGSS Performance Expectation | ||
|---|---|---|
|
MS-PS4-2. Develop and use a model to describe that waves are reflected, absorbed, or transmitted through various materials. (Grades 6 - 8) Do you agree with this alignment? |
||
| Click to view other curriculum aligned to this Performance Expectation | ||
| This activity focuses on the following Three Dimensional Learning aspects of NGSS: | ||
| Science & Engineering Practices | Disciplinary Core Ideas | Crosscutting Concepts |
| Develop and use a model to describe phenomena. Alignment agreement: | A sound wave needs a medium through which it is transmitted. Alignment agreement: When light shines on an object, it is reflected, absorbed, or transmitted through the object, depending on the object's material and the frequency (color) of the light.Alignment agreement: The path that light travels can be traced as straight lines, except at surfaces between different transparent materials (e.g., air and water, air and glass) where the light path bends.Alignment agreement: A wave model of light is useful for explaining brightness, color, and the frequency-dependent bending of light at a surface between media.Alignment agreement: However, because light can travel through space, it cannot be a matter wave, like sound or water waves.Alignment agreement: | Structures can be designed to serve particular functions by taking into account properties of different materials, and how materials can be shaped and used. Alignment agreement: |
International Technology and Engineering Educators Association - Technology
-
Design solutions by safely using tools, materials, and skills.
(Grades
3 -
5)
More Details
Do you agree with this alignment?
State Standards
Colorado - Science
-
Analyze and interpret data identifying ways Earth's surface is constantly changing through a variety of processes and forces such as plate tectonics, erosion, deposition, solar influences, climate, and human activity
(Grade
5)
More Details
Do you agree with this alignment?
-
Develop and communicate an evidence based scientific explanation around one or more factors that change Earth's surface
(Grade
5)
More Details
Do you agree with this alignment?
Materials List
Each group should have:
- 2 foot-long rulers which have four holes in them
- 2 fine-line markers
- 1 roll of adding machine paper (available at office supply stores)
- 1 small box approximately 6" L x 3" W x 2" H to fit the adding machine paper roll (the top of a box from bank checks works great)
- 1 medium-sized, strong rubber band
- Small strip of tag board or cardboard (about 1½" by 3")
- Cork or square eraser
- 2 pencils or a thin wood dowel that can fit through the holes in the rulers
For the class to share:
- X-acto® or utility knife
- 4-6 large, heavy books
- Masking, duct or transparent tape
- Scissors
Introduction/Motivation
The first earthquake measuring device was a seismoscope, which was invented in 132 A.D. in China by philosopher Chang Hêng. It was a vase-like instrument with eight dragon heads (each holding bronze ball) lined up in the eight principle directions of a compass with an open-mouthed toad lined up beneath each dragon head (see Figure 1). When an earthquake occurred, the dragon head which represented the direction of the earthquake would dislodge one of the bronze balls into the mouth of its corresponding toad. The fall of a certain ball allowed early scientists to determine the direction of the epicenter of the earthquake. Although the exact make-up of the interior cavity of this early seismoscope is not known, scientists believe that a pendulum was the primary sensing device that released the bronze ball from the dragon's mouth. Hêng's device became known as an "earthquake weathercock."

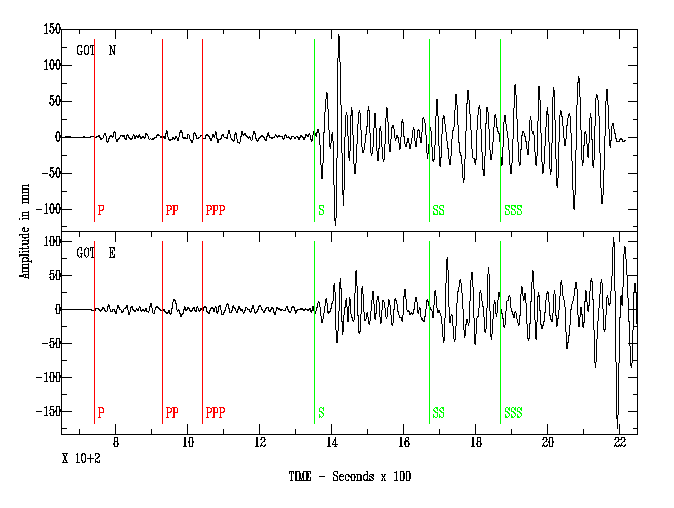
As the years progressed, earthquake measurement devices have become more sophisticated. Engineers work to design improved measurement devices to help people learn about and predict earthquakes. Today seismographs are used to determine the force of an earthquake. The device measures the seismic waves given off during an earthquake. The way a seismograph works is that paper is wrapped around a drum, and a stylus (or pen) which is very sensitive to even slight movement, marks the movement of a needle creating a seismogram — a record of the earthquake (see Figure 2). Therefore, the tremendous seismic waves caused by an earthquake result in the needle vibrating back and forth over a piece of paper to create a unique seismogram for each earthquake that occurs. Scientists and engineers use a seismograph measuring device to determine the strength of an earthquake. Engineers also want to be able to measure earthquakes so that they can help protect humans against the possible devastating effects of an earthquake.

In this activity, we get to be engineers by making a model of a seismograph, learning how it works and than brainstorming how to make it better. This model of a seismograph is somewhat different from real ones in that the paper is moved, instead of the pen, as in an actual seismograph.
Procedure
Before the Activity
- Gather the materials needed.
- Make a sample seismograph, using the following steps, for the students to use.
Constructing Paper Dispenser:
- Using an X-acto® or utility knife, cut a slit at the short end of the box along the edge of the top and side of the box, wide enough for the adding machine paper to slide through.
- Invert the box so that it sits open on the table.
- Put one of the thin markers through the center of the adding machine paper roll to act as an axle. So that the roll does not fall off the marker, put a strip of tape around the marker on either side of the roll.
- Set the marker across the open side of the box, so the finger tabs of the check box hold the marker in place. If a different type of box is used, cut small u-shaped indentations half-way along the long open sides of the box to hold the marker in place.
- Thread the end of the paper through the slit.
Constructing the Seismograph:
- Place a cork or square eraser between two rulers at about the four-inch mark. Tape in place.
- Wrap a rubber band tightly around the pair of rulers at the 1" end.
- Place a thin marker between the rulers next to the rubber band and near the end of the rulers. There should be enough tension to hold the marker in place.
- At the end where the rulers are far apart, wedge a pencil into each hole so the pencil points are facing each other, and the erasers are farthest away from the rulers. If a thin wooden dowel is available, thread it through the two holes of the rulers and omit the pencils.
- Make two stacks of large books on a table, about six to eight inches apart.
- Suspend the seismograph apparatus between the two stacks of books. The pencils will lie on the books, and the marker point should touch the table. Put another dictionary on top of each pencil to hold the apparatus steady.
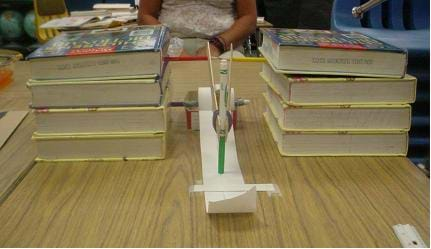
Assembling the Paper Dispenser and Seismograph (see Figure 3):
- Place the paper dispenser between the two stacks of books.
- Pull the strip of paper out of the box so it slides under the marker.
- About six inches from the marker tip, place a small strip of cardboard over the paper, and tape down on both sides. The paper will slide under this piece of cardboard, which will act as a guide and will keep the paper sliding along the table.

With the Students
Spilt the class into groups of four. Tell the students that each group is an engineering firm, and they should choose a name for their firm. Tell them that the town found a seismograph and does not know how it works. The town has asked their engineering firm to test the seismograph and figure out how it works.
Using the Apparatus:
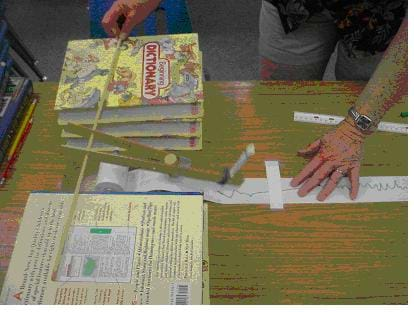
- Demonstrate to the students how to use the seismograph. (Steps 2 – 4).
- One student in the group should hold the pen apparatus steady by exerting light pressure on the top of each stack of books.
- One student should slowly pull the paper across the table.
- One student can intermittently shake the paper dispenser box from side to side to mimic an earthquake. (Note: The line on the paper will be straight, unless the paper dispenser is shaken.)
- Tell the students that each group should conduct two trials and make two seismograms. For Trial #1, they should shake the paper dispenser a lot, and for Trial #2, they should shake it just a little. The students should label their seismograms with the name of their engineering firm and a secret code for which trial it is (so the group measuring the seismogram will not know which trial is which). They should record the code in their science notebooks or on a separate piece of paper.

Measuring the Line:
- Have groups exchange seismograms. Explain that engineers always help each other by double checking each other's work and making sure they are correct.
- Each group should measure the distance from peak to peak (which the start and stop of the shaking of the paper dispenser) of both seismograms they received. Tell them to predict which seismogram was created from lots of shaking and which seismogram was created from just a little shaking from the heights they measured. Then have the students record the secret code, which trial they think it was and the height they measured in their science notebook or a separate piece of paper.
- Have each group tell the class which seismogram they thought was which and have the group that made the seismogram reveal the correct answer.
Drawing Conclusions:
- As a class, discuss how students could tell which seismogram was which. (They should be able to see that more shaking created a bigger seismogram with a larger distance from peak to peak.)
- Ask the students how the size or distance between peaks compares to the force of shaking. (Answer: The peaks increase with increased shaking.)
- Ask the students how they could improve the seismogram. (Could they make it stronger? Could they make it more sensitive to shaking?)
Assessment
Pre-Activity Assessment
Discussion/Brainstorming: As a class, have the students engage in open discussion. Solicit, integrate and summarize student responses. Give clues if necessary. Remind students that in brainstorming, no idea or suggestion is "silly." All ideas should be respectfully heard. Take an uncritical position, encourage wild ideas and discourage criticism of ideas. Have them raise their hands to respond. Record their ideas on the board. Ask the students:
- Ask students how you might measure an earthquake. (Possible answers: You can feel it, you can see it, and you can hear it. Then tell students that people cannot always feel earthquakes, but seismographs can.) Solicit ideas; give clues, and record ideas on the board.
Activity Embedded Assessment
Using Measurements to Predict: Each group should measure the distance from peak to peak of both seismograms they received. Tell them to predict which seismogram was created from lots of shaking and which seismogram was created from just a little shaking from the heights they measured. Then have the students record the secret code, which trial they think it was and the height they measured in their science notebook or a separate piece of paper. Have each group tell the class which seismogram they thought was which, and have the group that made the seismogram reveal the correct answer.
Post-Activity Assessment
Re-Engineering: Ask the students how they could improve the seismogram and have them sketch or test their ideas.
Town meeting: Tell the students that each group is an engineering firm. Each group should choose a name for their firm. Tell them that the town found a seismograph and does not know how it works. The town has asked their engineering firm to test the seismograph and figure out how it works. At a local town meeting, have the different engineering firms report back to the community on what they have discovered. Have the students make a short presentation or create an informative flyer for distribution to the community.
Safety Issues
Tell students to be gentle with the seismogram, it is only made of a cardboard box and rulers; it can easily break or fall apart.
Troubleshooting Tips
Play with the seismograph ahead of time to make sure you know how it works.
This is a great activity for stations or round-the-world type of activities on Earth's processes.
Activity Extensions
If it is possible to secure real seismograms, it would be interesting for students to read them. Visit http://earthquake.usgs.gov/regional/neic/ for information.
Subscribe
Get the inside scoop on all things Teach Engineering such as new site features, curriculum updates, video releases, and more by signing up for our newsletter!More Curriculum Like This

They make a model of a seismograph—a measuring device that records an earthquake on a seismogram. Students also investigate which structural designs are most likely to survive an earthquake.

Students learn what causes earthquakes, how we measure and locate them, and their effects and consequences. Through the online Earthquakes Living Lab, student pairs explore various types of seismic waves and the differences between shear waves and compressional waves.
References
Dewey, James and Perry Byerly. "The Early History of Seismometry (to 1900): The Earliest Seismoscope." Bulletin of the Seismological Society of America, Vol. 59, No. 1, pp. 183-227, February, 1969. http://earthquake.usgs.gov/regional/neic/
Copyright
© 2004 by Regents of the University of Colorado.Contributors
Jessica Todd; Melissa Straten; Malinda Schaefer Zarske; Janet YowellSupporting Program
Integrated Teaching and Learning Program, College of Engineering, University of Colorado BoulderAcknowledgements
The contents of this digital library curriculum were developed under a grant from the Fund for the Improvement of Postsecondary Education (FIPSE), U.S. Department of Education, and National Science Foundation GK-12 grant no 0338326. However, these contents do not necessarily represent the policies of the Department of Education or National Science Foundation, and you should not assume endorsement by the federal government.
Last modified: August 10, 2017


User Comments & Tips