Quick Look
Grade Level: 10 (9-11)
Time Required: 1 hour
Expendable Cost/Group: US $0.00 This activity requires non-expendable (reusable) LEGO MINDSTORMS robots and software; see the Materials List for details.
Group Size: 3
Activity Dependency: None
Subject Areas: Data Analysis and Probability, Geometry, Number and Operations, Reasoning and Proof
NGSS Performance Expectations:

| HS-ETS1-2 |
Summary
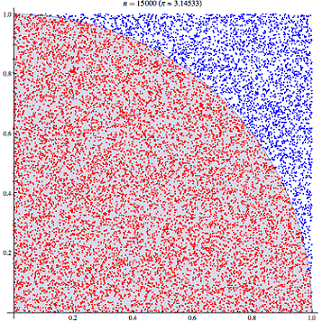
At its core, the LEGO® MINDSTORMS® product provides a programmable microprocessor. Students use the EV3 processor to simulate an experiment involving thousands of uniformly random points placed within a unit square. Using the underlying geometry of the experimental model, as well as the geometric definition of the constant π (pi), students form an empirical ratio of areas to estimate a numerical value of π. Although typically used for numerical integration of irregular shapes, in this activity, students use a Monte Carlo simulation to estimate a common but rather complex analytical form—the numerical value of the most famous irrational number, π.Engineering Connection
Monte Carlo methods are a class of simulation and sampling techniques that investigate models at randomly chosen points. These methods are widely used by engineers, scientists and mathematicians to perform numerical integration of complex functions of many variables, having no closed form. Monte Carlo is a classical technique in particle physics. More recent innovations include the ability to simultaneously track multiple objects in computer vision, and generally to track the state of observed "particles." Such progress has been made possible by recognizing the link between Monte Carlo integration and Bayesian estimation.
Learning Objectives
After this activity, students should be able to:
- (advanced) describe the link between frequentist probability (or, frequentism) and geometry
- quantify how the proportion of areas is reflected in outcome of the experiment
- distinguish between the geometric definition of π is and the numerical representation of π
- assess the quality of an estimate using percent error (or standard error for more advanced classes)
- confidently design a simulated experiment
Educational Standards
Each TeachEngineering lesson or activity is correlated to one or more K-12 science,
technology, engineering or math (STEM) educational standards.
All 100,000+ K-12 STEM standards covered in TeachEngineering are collected, maintained and packaged by the Achievement Standards Network (ASN),
a project of D2L (www.achievementstandards.org).
In the ASN, standards are hierarchically structured: first by source; e.g., by state; within source by type; e.g., science or mathematics;
within type by subtype, then by grade, etc.
Each TeachEngineering lesson or activity is correlated to one or more K-12 science, technology, engineering or math (STEM) educational standards.
All 100,000+ K-12 STEM standards covered in TeachEngineering are collected, maintained and packaged by the Achievement Standards Network (ASN), a project of D2L (www.achievementstandards.org).
In the ASN, standards are hierarchically structured: first by source; e.g., by state; within source by type; e.g., science or mathematics; within type by subtype, then by grade, etc.
NGSS: Next Generation Science Standards - Science
| NGSS Performance Expectation | ||
|---|---|---|
|
HS-ETS1-2. Design a solution to a complex real-world problem by breaking it down into smaller, more manageable problems that can be solved through engineering. (Grades 9 - 12) Do you agree with this alignment? |
||
| Click to view other curriculum aligned to this Performance Expectation | ||
| This activity focuses on the following Three Dimensional Learning aspects of NGSS: | ||
| Science & Engineering Practices | Disciplinary Core Ideas | Crosscutting Concepts |
| Design a solution to a complex real-world problem, based on scientific knowledge, student-generated sources of evidence, prioritized criteria, and tradeoff considerations. Alignment agreement: | Criteria may need to be broken down into simpler ones that can be approached systematically, and decisions about the priority of certain criteria over others (trade-offs) may be needed. Alignment agreement: | |
Common Core State Standards - Math
-
Use data from a sample survey to estimate a population mean or proportion; develop a margin of error through the use of simulation models for random sampling.
(Grades
9 -
12)
More Details
Do you agree with this alignment?
-
Apply concepts of density based on area and volume in modeling situations (e.g., persons per square mile, BTUs per cubic foot).
(Grades
9 -
12)
More Details
Do you agree with this alignment?
-
Summarize, represent, and interpret data on a single count or measurement variable
(Grades
9 -
12)
More Details
Do you agree with this alignment?
-
Graph linear and quadratic functions and show intercepts, maxima, and minima.
(Grades
9 -
12)
More Details
Do you agree with this alignment?
-
Use the mean and standard deviation of a data set to fit it to a normal distribution and to estimate population percentages. Recognize that there are data sets for which such a procedure is not appropriate. Use calculators, spreadsheets, and tables to estimate areas under the normal curve.
(Grades
9 -
12)
More Details
Do you agree with this alignment?
-
Calculate expected values and use them to solve problems
(Grades
9 -
12)
More Details
Do you agree with this alignment?
-
(+) Calculate the expected value of a random variable; interpret it as the mean of the probability distribution.
(Grades
9 -
12)
More Details
Do you agree with this alignment?
International Technology and Engineering Educators Association - Technology
-
Students will develop an understanding of the role of troubleshooting, research and development, invention and innovation, and experimentation in problem solving.
(Grades
K -
12)
More Details
Do you agree with this alignment?
State Standards
New York - Math
-
Graph linear and quadratic functions and show intercepts, maxima, and minima.
(Grades
9 -
12)
More Details
Do you agree with this alignment?
-
Calculate expected values and use them to solve problems
(Grades
9 -
12)
More Details
Do you agree with this alignment?
-
Use data from a sample survey to estimate a population mean or proportion; develop a margin of error through the use of simulation models for random sampling.
(Grades
9 -
12)
More Details
Do you agree with this alignment?
-
Use the mean and standard deviation of a data set to fit it to a normal distribution and to estimate population percentages. Recognize that there are data sets for which such a procedure is not appropriate. Use calculators, spreadsheets, and tables to estimate areas under the normal curve.
(Grades
9 -
12)
More Details
Do you agree with this alignment?
-
(+) Calculate the expected value of a random variable; interpret it as the mean of the probability distribution.
(Grades
9 -
12)
More Details
Do you agree with this alignment?
-
Summarize, represent, and interpret data on a single count or measurement variable
(Grades
9 -
12)
More Details
Do you agree with this alignment?
-
Apply concepts of density based on area and volume in modeling situations (e.g., persons per square mile, BTUs per cubic foot).
(Grades
9 -
12)
More Details
Do you agree with this alignment?
New York - Science
-
Design a solution to a complex real-world problem by breaking it down into smaller, more manageable problems that can be solved through engineering.
(Grades
9 -
12)
More Details
Do you agree with this alignment?
Materials List
Each group needs:
- LEGO MINDSTORMS EV3 robot, such as EV3 Core Set (5003400) at https://education.lego.com/en-us/products/lego-mindstorms-education-EV3-core-set-/5003400
- LEGO MINDSTORMS Education EV3 Software 1.2.1, free online, you have to register a LEGO account first; at https://www.lego.com/en-us/themes/mindstorms/downloads
- computer, loaded with EV3 1.2.1 software
- notepad for logging results
- A Chance at Monte Carlo Pre-Quiz, one per student
- Monte Carlo Simulation Worksheet, one per student
- Standard Error Flowchart, one per student
- A Chance at Monte Carlo Post-Quiz, one per student
Note: This activity can also be conducted with the older (and no longer sold) LEGO MINDSTORMS NXT set instead of EV3; see below for those supplies:
- LEGO MINDSTORMS NXT robot, such as the NXT Base Set
- LEGO MINDSTORMS Education NXT Software 2.1
- computer, loaded with NXT 2.1 software
Worksheets and Attachments
Visit [www.teachengineering.org/activities/view/nyu_montecarlo_activity1] to print or download.Pre-Req Knowledge
Students should be comfortable with the following:
- computing the area of a square and a circle
- applying data analysis concepts: mean, percent error (advanced: standard error)
- (to be reinforced) the equation of a circle: x2 + y2 = r2
- (optional) uniform probability distributions
Introduction/Motivation
(Note: Show students the Monte Carlo Presentation to illustrate the concepts developed in this section.)
In the classroom, we always encounter problems that can be conveniently solved using the equations we learn. In particular, when we encounter a shape, we learn to break it down into triangles, rectangles and ellipses. That way, we can use the component geometries to define the composite geometry. With today's activity, we are going to explore ways that scientists and engineers attempt to make calculations when an equation is hard to approximate or even hard to define.
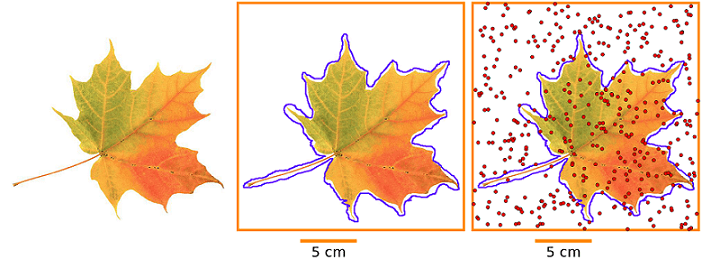
Let's propose a method for computing area that is based on chance. Imagine that we have drawn a leaf on a large sketch pad and we want to determine the size of the leaf in area. First, we bound the leaf with a known shape (for example, a square). Then we scatter ink drops over the entire sketch pad in a uniformly random pattern, meaning with equal probability of occurring anywhere. Knowing this, we can safely say that the number of ink drops landing inside the leaf, divided by the total number of ink drops inside the square, approximates the proportion of the area of the leaf within the square. Since the area of the square is known, the unknown area of the leaf is approximated. The method we have just proposed is an example of Monte Carlo sampling, named after the famous casino in Monaco, France. (Show students Figure 1 or slides 10-12 of the Monte Carlo Presentation, which illustrate this idea.)
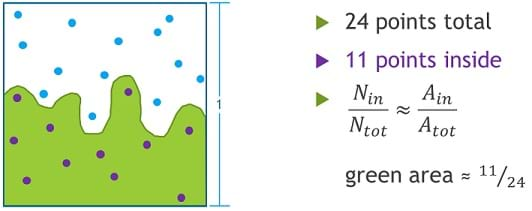
(Show students Figure 2, also shown on slide 6 of the Monte Carlo Presentation). This demonstrates a coarse approximation of an arbitrary shape (the green area) in more detail. In this drawing, 24 red points are arbitrarily placed inside the unit square. The calculations shown approximate the green area and, logically, the result seems about right. We can visually confirm that the area is less than half, because if we draw a horizontal line midway through the box, we see slightly less green area above the line than white area below the line. Would it be a good idea to repeat the process with more than 24 points?
Monte Carlo methods are typically used for integrating complicated functions, such as counting the irregular area of a leaf, but today we challenge the application of Monte Carlo sampling by estimating the area of a simple shape whose geometry depends on the constant π. To do so, we will not conduct a physical experiment with paper and ink. Instead, we will use the LEGO MINDSTORMS EV3 Intelligent Brick to simulate the placement of points and then to count those points and report a ratio.
After taking a few trial estimates, we explore the quality of the mean estimate by considering either A) the percent error with respect to a reference value (3.14159...), or B) the standard error, or within sample variation. (Note: Option A is recommended for less-advanced students, while option B is recommended for more-advanced students.)
Procedure
Before the Activity
- If it is preferred to not develop a program in class, pre-program the EV3 bricks with the Monte Carlo Program.
- Make copies of the A Chance at Monte Carlo Pre-Quiz, Monte Carlo Simulation Worksheet, Standard Error Flowchart. and A Chance at Monte Carlo Post-Quiz.
With the Students
Developing the Experiment
- Develop the geometrical setting of the classroom experiment:
- Provide each student with a worksheet.
- Ask students to focus their attention on the first two worksheet pages, beginning with the circle inscribed within a square with side length 2. Remind students that the ratio of the circle to square areas is π/4. They can verify this using their knowledge of the equations for finding areas of squares and circles.
- The ratio remains identical for the positive quadrant of the square. This quadrant is to simplify computations on the second page of the worksheet.
- Point out that we only know the "solution" for this geometrical problem if we know the value of π.
- Have students complete the first two worksheet pages.
- (optional, time permitting) Explain how a computer can generate uniformly random outcomes:
- A computer can generate coordinates (x, y), each between 0 and 100. (Note: Since the EV3 only provides integer arithmetic, make all calculations in 100x numbers. The maximum integer seen on the EV3 brick is 215-1 = 32767, therefore 1002 + 1002 = 20000 is an acceptable value. If leading the class in designing the program, this detail may require some explanation.)
- Calculating whether x2 + y2 < 1002 for a given point (x,y) determines whether the point is inside or outside the circle. If x2 + y2 < 1002, the point is within the circle, and if x2 + y2 > 1002, the point is outside the circle.
- Therefore, using a Monte Carlo sampling within this unit-area frame, the relative frequency of points inside the circle should be approximately π/4.
- The computer can repeat this experiment several hundreds or thousands of times in order to improve the accuracy of the estimate of π. Additionally, we can change the number of simulated points during each experiment. How does the accuracy of the estimate change with number of points? (Answer: The accuracy of the estimate increases as the number of points increases.)
Collecting Data
(optional: For this step, students should be comfortable writing programs with the EV3 software. Alternatively, use the Monte Carlo Program.)
- Students plan and implement a program for the EV3 brick using the LEGO software to simulate 100 random points. A portion of the Monte Carlo Program is shown in Figure 3.
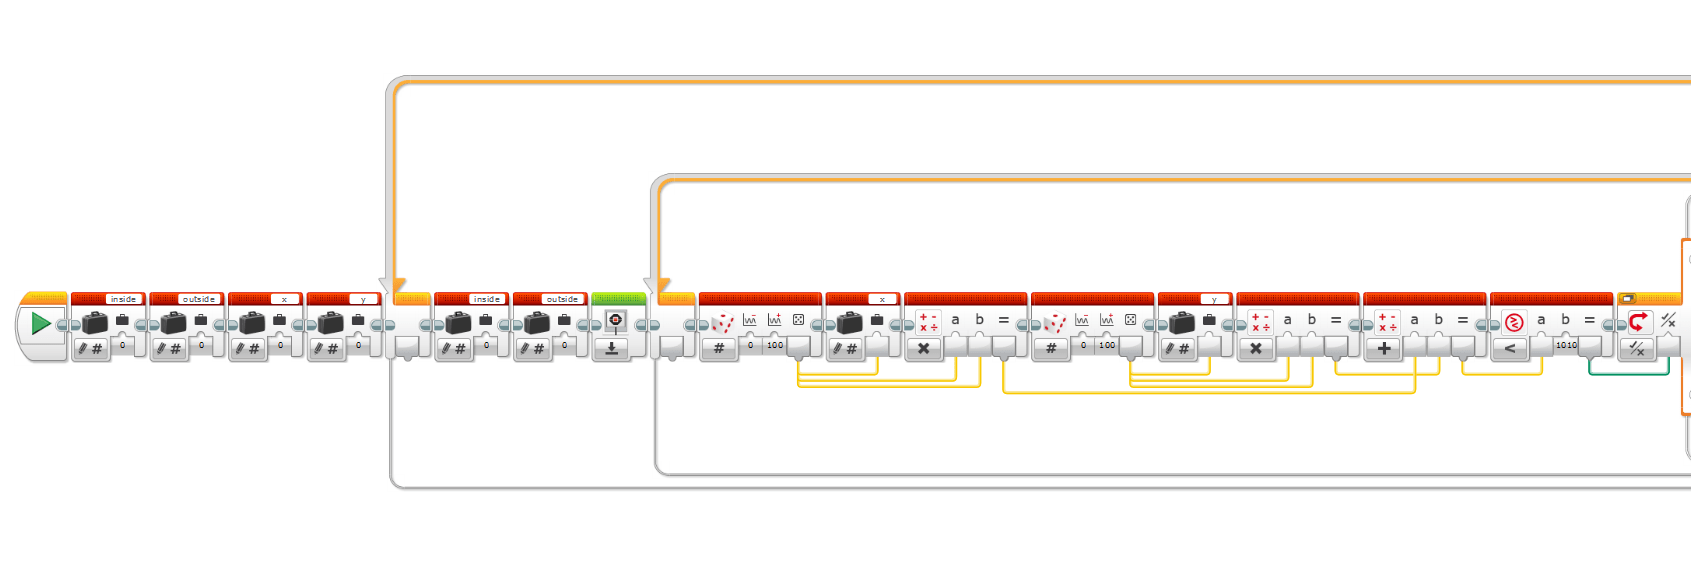
Figure 3. An example segment of the Monte Carlo Program. - Using a student-developed program or the Monte Carlo program, run five experiment simulations, each using 100 points.
- Repeat step 1 of this section, changing the number of simulated points to 500, 1000, and 4000. Note that the EV3 brick needs to be reprogrammed for each number of points. Instructions on how to vary the number of points is included in the appropriate position on the Monte Carlo program.
- For each set of five samples, estimate π by computing the mean of the set. For example, the mean of five estimates from the 1000-point simulation is:
(3.126 + 3.176 + 3.080 + 3.110 + 3.178)/5 = 3.1340
- Assess the quality of each estimate by percent error, and/or the standard error. For the samples above, the percent error is calculated against a reference value for π
100 x | 3.1340 - 3.14159 | / 3.14159 = 0.24%
To calculate the standard error, students can use the flowchart, as shown in Figure 4.
- Students complete the remainder of the worksheet to turn in.
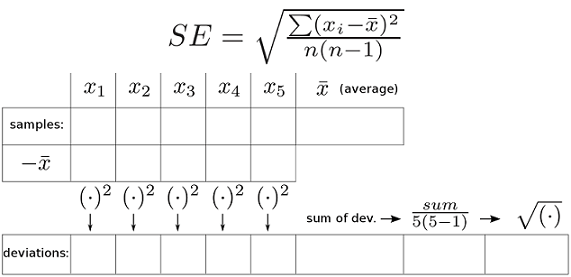
Figure 4. Flowchart for the calculation of standard error. - As a class, discuss the results and conclusions from this experiment. Ask students:
- How is the quality changing with the number of simulation points? (Answer: The estimates for π are improving; both the percent error and the standard error are converging to zero.)
- What is the effect of averaging the five outcomes for each experiment setting? (Answer: Since each estimate is part truth and part error, averaging five outcomes reinforces the true component (π) and reduces the erroneous part.)
Vocabulary/Definitions
geometric constant: A number that arises in describing shapes at all scales (for example, pi or the golden ratio phi).
outcome: An event whose chance of occurring is governed by the probability distribution.
random: Suggesting variation from trial to trial; not deterministic.
simulation: A numerical/computational model of a physical scenario.
Assessment
Pre-Activity Assessment
Pre-Quiz: Have students complete the A Chance at Monte Carlo Pre-Quiz, which asks them questions on the following topics:
- understanding/familiarity with the use of computers and programming
- distinction between the value of a geometrical constant and its meaning
- insight into uses of random outcomes
Collect and grade the quiz to gauge students' prior knowledge on these topics.
Activity Embedded Assessment
Worksheet: During the activity, have students complete the Monte Carlo Simulation Worksheet. Through a series of familiar geometry problems, students are guided through the model scenario for the Monte Carlo simulation to compute the value of pi. The last two pages help students organize and interpret their results. Review their answers to assess their depth of comprehension.
Post-Activity Assessment
Post-Quiz: Administer the A Chance at Monte Carlo Post-Quiz to assess students' comprehension of the same topics as the pre-quiz, although the post-quiz asks deeper and more specific questions. Review students' answers to gauge their learning during the activity.
Troubleshooting Tips
Encourage students to collect all of their data (five samples each for a varying number of simulation points) up front, before moving through the statistical analysis.
Subscribe
Get the inside scoop on all things Teach Engineering such as new site features, curriculum updates, video releases, and more by signing up for our newsletter!Copyright
© 2013 by Regents of the University of Colorado; original © 2013 Polytechnic Institute of New York UniversityContributors
Michael Trumpis, Carleigh Samson, Janet YowellSupporting Program
AMPS GK-12 Program, Polytechnic Institute of New York UniversityAcknowledgements
This activity was developed by the Applying Mechatronics to Promote Science (AMPS) Program funded by National Science Foundation GK-12 grant no. 0741714. However, these contents do not necessarily represent the policies of the NSF, and you should not assume endorsement by the federal government.
Additional support was provided by the Central Brooklyn STEM Initiative (CBSI), funded by six philanthropic organizations.
Last modified: October 16, 2020


User Comments & Tips