
Quick Look
Grade Level: 11 (11-12)
Time Required: 5 hours 15 minutes
(seven 45-minute sessions)
Expendable Cost/Group: US $0.00
Group Size: 3
Activity Dependency: None
Subject Areas: Computer Science, Data Analysis and Probability, Measurement, Problem Solving, Reasoning and Proof, Science and Technology
NGSS Performance Expectations:

| HS-ETS1-2 |
| HS-ETS1-3 |
| HS-ETS1-4 |
Quick Look

- Grade Level:
- 11 (11 – 12)
- Time Required:
- 5 hours 15 minutes
(seven 45-minute sessions)
- Group Size:
- 3
- Subject Areas:
-
Computer Science Data Analysis and Probability Measurement Problem Solving Reasoning and Proof Science and Technology -
NGSS Performance Expectations:
HS-ETS1-2 HS-ETS1-3 HS-ETS1-4

Summary
In this high school engineering activity, students use a sound level meter or Arduino microcontrollers to measure sound levels at various locations and then analyze the data. The project begins with identifying constraints and learning to set up and program Arduino devices with sound sensors, while also brainstorming community issues related to noise pollution. Students then collect sound level data over time, analyze it using descriptive statistics, and create graphs and charts to visualize trends. Applying principles of sound insulation and damping, they design and build a soundproofing system, test its effectiveness by measuring sound levels before and after application, and use statistical tests to determine whether the reduction is significant.Engineering Connection
Acoustic engineers study how sound is produced, transmitted, and controlled, applying this knowledge to design solutions for real-world problems. They work on reducing unwanted noise, improving sound quality in spaces such as concert halls or classrooms, and developing technologies such as soundproofing materials, speakers, microphones, and ultrasound devices. Their work blends physics, engineering, and human perception of sound to create environments and products that manage noise effectively and enhance how we experience sound.
Learning Objectives
After this activity, students should be able to:
- Apply the engineering design process and statistical analyses to design, build, and test a soundproofing system.
- Explain the principles of sound waves, sound intensity, and noise reduction.
- Identify problems related to noise pollution and brainstorm potential design solutions.
- Use basic programming skills to configure and operate Arduino devices (if Arduino will be utilized).
- Use hypothesis testing and statistics to summarize and interpret data and make data-driven conclusions about the effectiveness of the sound-proofing system students design.
Educational Standards
Each Teach Engineering lesson or activity is correlated to one or more K-12 science,
technology, engineering or math (STEM) educational standards.
All 100,000+ K-12 STEM standards covered in Teach Engineering are collected, maintained and packaged by the Achievement Standards Network (ASN),
a project of D2L (www.achievementstandards.org).
In the ASN, standards are hierarchically structured: first by source; e.g., by state; within source by type; e.g., science or mathematics;
within type by subtype, then by grade, etc.
Each Teach Engineering lesson or activity is correlated to one or more K-12 science, technology, engineering or math (STEM) educational standards.
All 100,000+ K-12 STEM standards covered in Teach Engineering are collected, maintained and packaged by the Achievement Standards Network (ASN), a project of D2L (www.achievementstandards.org).
In the ASN, standards are hierarchically structured: first by source; e.g., by state; within source by type; e.g., science or mathematics; within type by subtype, then by grade, etc.
NGSS: Next Generation Science Standards - Science
| NGSS Performance Expectation | ||
|---|---|---|
|
HS-ETS1-2. Design a solution to a complex real-world problem by breaking it down into smaller, more manageable problems that can be solved through engineering. (Grades 9 - 12) Do you agree with this alignment? |
||
| Click to view other curriculum aligned to this Performance Expectation | ||
| This activity focuses on the following Three Dimensional Learning aspects of NGSS: | ||
| Science & Engineering Practices | Disciplinary Core Ideas | Crosscutting Concepts |
| Design a solution to a complex real-world problem, based on scientific knowledge, student-generated sources of evidence, prioritized criteria, and tradeoff considerations. Alignment agreement: | Criteria may need to be broken down into simpler ones that can be approached systematically, and decisions about the priority of certain criteria over others (trade-offs) may be needed. Alignment agreement: | |
| NGSS Performance Expectation | ||
|---|---|---|
|
HS-ETS1-3. Evaluate a solution to a complex real-world problem based on prioritized criteria and trade-offs that account for a range of constraints, including cost, safety, reliability, and aesthetics, as well as possible social, cultural, and environmental impacts. (Grades 9 - 12) Do you agree with this alignment? |
||
| Click to view other curriculum aligned to this Performance Expectation | ||
| This activity focuses on the following Three Dimensional Learning aspects of NGSS: | ||
| Science & Engineering Practices | Disciplinary Core Ideas | Crosscutting Concepts |
| Evaluate a solution to a complex real-world problem, based on scientific knowledge, student-generated sources of evidence, prioritized criteria, and tradeoff considerations. Alignment agreement: | When evaluating solutions it is important to take into account a range of constraints including cost, safety, reliability and aesthetics and to consider social, cultural and environmental impacts. Alignment agreement: | New technologies can have deep impacts on society and the environment, including some that were not anticipated. Analysis of costs and benefits is a critical aspect of decisions about technology. Alignment agreement: |
| NGSS Performance Expectation | ||
|---|---|---|
|
HS-ETS1-4. Use a computer simulation to model the impact of proposed solutions to a complex real-world problem with numerous criteria and constraints on interactions within and between systems relevant to the problem. (Grades 9 - 12) Do you agree with this alignment? |
||
| Click to view other curriculum aligned to this Performance Expectation | ||
| This activity focuses on the following Three Dimensional Learning aspects of NGSS: | ||
| Science & Engineering Practices | Disciplinary Core Ideas | Crosscutting Concepts |
| Use mathematical models and/or computer simulations to predict the effects of a design solution on systems and/or the interactions between systems. Alignment agreement: | Both physical models and computers can be used in various ways to aid in the engineering design process. Computers are useful for a variety of purposes, such as running simulations to test different ways of solving a problem or to see which one is most efficient or economical; and in making a persuasive presentation to a client about how a given design will meet his or her needs. Alignment agreement: | Models (e.g., physical, mathematical, computer models) can be used to simulate systems and interactions—including energy, matter, and information flows—within and between systems at different scales. Alignment agreement: |
Common Core State Standards - Math
-
Make sense of problems and persevere in solving them.
(Grades
K -
12)
More Details
Do you agree with this alignment?
-
Reason abstractly and quantitatively.
(Grades
K -
12)
More Details
Do you agree with this alignment?
-
Construct viable arguments and critique the reasoning of others.
(Grades
K -
12)
More Details
Do you agree with this alignment?
-
Model with mathematics.
(Grades
K -
12)
More Details
Do you agree with this alignment?
-
Use appropriate tools strategically.
(Grades
K -
12)
More Details
Do you agree with this alignment?
-
Attend to precision.
(Grades
K -
12)
More Details
Do you agree with this alignment?
-
Understand statistics as a process for making inferences about population parameters based on a random sample from that population.
(Grades
9 -
12)
More Details
Do you agree with this alignment?
-
Recognize the purposes of and differences among sample surveys, experiments, and observational studies; explain how randomization relates to each.
(Grades
9 -
12)
More Details
Do you agree with this alignment?
-
Use data from a randomized experiment to compare two treatments; use simulations to decide if differences between parameters are significant.
(Grades
9 -
12)
More Details
Do you agree with this alignment?
-
Evaluate reports based on data.
(Grades
9 -
12)
More Details
Do you agree with this alignment?
Materials List
Each student needs:
Each group needs:
- 1 tone generator
- 1 Decibel X: dB, dBA Noise Meter
- 2 smart phones
- 1 shoe box for the prototype
- 1 roll of tape
- 1 pair of scissors
- glue
- 1 computer/laptop/Chromebook
- chart paper
If Arduino is utilized, each group needs:
- 1 Arduino Uno microcontroller
- Access to Arduino IDE
- 1 SparkFun sound sensor
- jumper wires
- 1 breadboard
- (optional) 1 Code Sheet
- (optional) 1 Fill-In-The-Blank Code Sheet
For the entire class to share:
- 1 speaker
- More expensive materials
- Less expensive materials
- felt fabric
- cotton balls
- wood sheet
- aluminum foil
- foam
- large papers such as newspaper
- corkboard
- sponges
- steel wool
- bubble wrap
Worksheets and Attachments
Visit [www.teachengineering.org/activities/view/uok-2996-statistical-analysis-noise-detection-soundproofing] to print or download.Pre-Req Knowledge
Students should:
- Have a basic understanding of the properties of sound waves, including frequency, amplitude, and wavelength.
- Be familiar with how sound intensity is measured, and the concept of decibels (dB).
- Understand mean, median, mode, and standard deviation, and how to calculate them.
- Have a basic understanding of hypothesis testing, including null and alternative hypotheses, significance levels, and p-values.
- Be familiar with t-tests and their application in comparing two sets of data.
Students should (if Arduino will be utilized):
- Understand basic programming concepts such as variables, loops, and conditionals.
- Be familiar with the Arduino Integrated Development Environment (IDE) and writing simple programs to interface with sensors.
- Have knowledge of basic electronic components such as resistors and capacitors, and how to connect them on a breadboard.
- Understand how sensors work, and how to integrate them with microcontrollers.
Introduction/Motivation
(Notice and Wonder: The National Council of Teachers of Mathematics (NCTM) stated that by asking, "What do you notice? What do you wonder?" we help our students see problems in big-picture ways. Self-confidence, reflective skills, and engagement soar, and students discover that the goal is not to be "over and done," but rather to discover multiple strategies for tackling a problem. This also helps address math anxiety.)
I am going to show you a video, and I want you to individually think about notices and wonders. (Show https://www.youtube.com/watch?v=5jfmzufa8qo [4:20 minutes]). What do you notice, and what do you wonder about the video you just watched? (Give students a few minutes to individually complete their Notice and Wonder Sheet.)
When done, share your ideas with your team.
(Provide each team with a chart paper. Give them two to three minutes to compile their notices and wonders. When done, you may ask them to post their chart paper, ask each team to share their thinking, consolidate as a class, and produce one wonder. If there is a wonder about how to reduce sound, then use that. Otherwise, prepare purposeful questions to ask students so the class will produce this wonder.)
As a class, we will address this wonder:” How can we design and test an effective soundproofing system and statistical analysis to reduce/minimize noise levels in various environments?”
In your learning teams, brainstorm ideas on the following prompts. Write your ideas on the whiteboard (or on chart paper if whiteboards are not available).
- Think Tank Time! How can we design a soundproofing system that effectively reduces noise in different environments such as a busy street, a loud classroom, or even a recording studio? Provide scientific explanations that support your design.
- Testing, Testing... Once we have our designs, what methods could we use to test how well they block sound? Justify your reasoning using scientific explanations.
- Stat Attack! How can we use statistical analysis, specifically hypothesis testing, to measure the effectiveness of our soundproofing solutions and see if they truly minimize noise levels?
(Provide another 5 minutes for this brainstorming. Post their chart paper on the wall; this can be a working document that students may edit/modify as they work on their design.)
Welcome to our exciting engineering and statistics activity! In this activity, you will get hands-on experience with these concepts by using a smartphone application or an Arduino microcontroller to measure sound levels. You will analyze this data, using descriptive and inferential statistics to draw meaningful conclusions. Then, you will apply your findings to design and build a soundproofing system. By testing your design and conducting hypothesis tests, you will learn how engineers use scientific and mathematical principles to solve real-world problems. Get ready to explore the fascinating world of acoustics and soundproofing, develop critical thinking skills, and see the direct application of your classroom knowledge in a practical, impactful project!
Procedure
Background
Hypothesis Testing
Hypothesis testing is a fundamental method in statistics used to determine whether there is enough evidence to support a specific hypothesis about a dataset. It begins with formulating two hypotheses:
- Null Hypothesis (H₀): A statement that there is no effect or no difference, which serves as the default assumption.
- Alternative Hypothesis (Ha): A statement that indicates the presence of an effect or a difference.
The process involves collecting data and calculating a test statistic, which is then compared to a threshold value (critical value) to decide whether to reject the null hypothesis. The outcome helps determine if the observed data provides sufficient evidence to support the alternative hypothesis.
Statistical Significance:
Statistical significance is a measure that helps us understand whether the results of a hypothesis test are likely due to chance or whether they reflect a true effect. It is typically assessed using a p-value, which quantifies the probability of obtaining results at least as extreme as those observed, assuming the null hypothesis is true.
- P-Value: If the p-value is lower than a predefined significance level (commonly 0.05), the results are considered statistically significant, leading to the rejection of the null hypothesis.
Importance of Hypothesis Testing:
- Decision Making: Hypothesis testing and statistical significance guide decision-making processes in various fields, including science, engineering, medicine, and social sciences. They help determine whether a new treatment works, whether a product improvement is effective, and whether a new process is better than the old one.
- Objectivity: These methods provide an objective framework for evaluating evidence, reducing reliance on intuition or subjective judgment. By using a standardized approach, researchers can make informed decisions based on data.
- Validity and Reliability: Ensuring that results are statistically significant increases the validity and reliability of findings. It helps to avoid making conclusions based on random chance and provides confidence that the observed effects are real and reproducible.
- Resource Allocation: In engineering and business, hypothesis testing helps allocate resources efficiently. For instance, it can determine whether investing in a new technology or process improvement will likely yield significant benefits.
In this soundproofing module, hypothesis testing, and statistical significance play crucial roles in evaluating the effectiveness of the designed soundproofing system. Here is how they support this module:
- Formulating Hypotheses:
- Null Hypothesis (H₀): The soundproofing system does not significantly reduce sound levels (no difference before and after applying the system). μ1 = μ2
- Alternative Hypothesis (Ha): The soundproofing system significantly reduces sound levels (a noticeable difference before and after applying the system). μ1 > μ2
Formulating these hypotheses helps clarify the objective of the project and sets a clear goal for the students.
- Collecting and Analyzing Data:
- Students will measure sound levels before and after implementing the soundproofing system using a smartphone app or Arduino microcontrollers.
- They will collect data and perform descriptive statistics to summarize the sound levels.
- Conducting Hypothesis Tests:
- Students will use statistical tests, such as t-tests, to compare the mean sound levels before and after applying the soundproofing system.
- This comparison will help determine whether the observed reduction in sound levels is statistically significant or likely due to random variation.
- Interpreting Results:
- P-Value Calculation: The p-value obtained from the hypothesis test will indicate whether the reduction in sound levels is statistically significant.
- Decision Making: If the p-value is less than the predefined significance level (e.g., 0.05), students will reject the null hypothesis and conclude that the soundproofing system effectively reduces sound levels.
- Validating the Design:
- Hypothesis testing provides an objective method to validate the effectiveness of the soundproofing system.
- By demonstrating statistical significance, students can confidently claim that their design has a real impact, supported by data.
- Enrichment/Extension
- Students may use different materials and do hypothesis testing with them as well.
- Economics is embedded as students compare more costly materials to less expensive ones to determine whether there is a significant difference in their sound reduction effect.
- Iterative Improvement:
- If the initial design does not show significant results, students can use feedback to refine and improve their soundproofing system.
- This iterative process of testing and improving mirrors real-world engineering practices.
By integrating hypothesis testing and statistical significance into the soundproofing module, students learn how to apply theoretical knowledge to evaluate and improve engineering designs, ensuring their solutions are effective and data-driven.
Sound Waves
Sound is a type of energy that travels through the air (or other mediums) as waves. Here are some key concepts about sound waves that are essential for this project:
- Nature of Sound Waves:
- Sound waves are longitudinal waves, meaning the particles of the medium (air, water, etc.) vibrate parallel to the direction of the wave's travel.
- They consist of compressions (high-pressure regions) and rarefactions (low-pressure regions).
- These waves can be reflected, absorbed, or transmitted through various materials. When sound bounces off walls, especially in large spaces, you hear it repeated—that is an echo! Soft things like carpets and earmuffs can soak up sound waves, making them quieter. Sound waves can also pass right through solid objects, such as walls. That is why you can sometimes hear someone yelling from another room! Materials that gobble up sound waves are called sound absorbers, not insulators. (Note: We use insulators to block sound transmission, not absorption.)

- Frequency and Pitch:
- Frequency: The number of wave cycles per second, measured in Hertz (Hz). Higher frequency sounds are perceived as higher pitch, while lower frequency sounds are perceived as lower pitch.
- Pitch: The human perception of sound frequency. For example, a piano’s high notes have a higher pitch than its low notes.
- Amplitude and Loudness:
- Amplitude: The height of the wave, which determines the sound's loudness. Higher amplitude means a louder sound.
- Loudness: The human perception of sound intensity, typically measured in decibels (dB). Everyday sounds range from the quiet rustle of leaves (about 10 dB) to the loud roar of a jet engine (about 120 dB).
- Decibels (dB): Decibel is a relative unit, meaning it expresses a ratio between two values (like a percentage). It is one-tenth of a bel (a rarely used unit named after Alexander Graham Bell). Decibels are measured on a logarithmic scale. This means that a small increase in dB can represent a significant jump in intensity or power. It is widely used in various fields such as acoustics, electronics, and control theory to quantify sound levels, signal power, and other types of power ratios.
- Key Characteristics of Decibels
- Logarithmic Nature: The decibel scale is logarithmic, meaning it represents ratios in terms of orders of magnitude rather than linear differences. This allows for a wide range of values to be represented in a more manageable way.
- Relative Measurement: Decibels express the ratio between two quantities. For example, if P1 and P2 are two power levels, the ratio in decibels is calculated as:
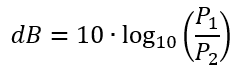
If the quantities are voltages or currents, the formula involves a factor of 20 instead of 10.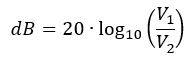
- Applications in Acoustics: In acoustics, decibels are used to measure sound pressure level (SPL). The reference value is typically the threshold of hearing, denoted as 20 μPa. The SPL in decibels is given by:
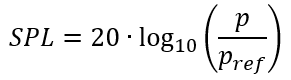
where p is the sound pressure of the sound wave and pref is the reference sound pressure (20μPa)
- Electronics and Signal Processing: In electronics, decibels are used to express gains and losses in amplifiers and other components. For example, the gain of an amplifier can be expressed as:
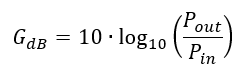
where Pout is the output power and Pin is the input power.
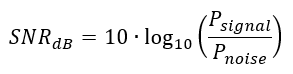
- Control Systems: In control theory and telecommunications, decibels are used to express signal-to-noise ratios (SNR), attenuation, and various other parameters. The SNR in decibels is:
 from 30 to 140, colored green, yellow, and red. Each 10-dB increment (or slightly more in some ranges) is associated with common sounds.")
- Wavelength:
- The distance between consecutive compressions or rarefactions. Wavelength and frequency are inversely related: higher frequency sounds have shorter wavelengths.
- Speed of Sound:
- The speed at which sound waves travel, which depends on the medium. In air, sound travels at about 343 meters per second (m/s) at room temperature.
Soundproofing
Soundproofing involves techniques and materials used to reduce or block sound transmission from one area to another. Here are the fundamental concepts:
- Principles of Soundproofing:
- Sound Reflection:
- Concept: When sound waves encounter a surface, they can bounce back into the original medium, similar to how light reflects off a mirror.
- Surfaces: Hard, smooth surfaces such as walls, floors, and ceilings reflect sound waves more efficiently, causing echoes and reverberation.
- Applications: Understanding reflection is crucial for designing spaces such as auditoriums and concert halls, where controlled sound reflection is needed to enhance acoustics.
- Sound Absorption:
- Concept: Absorption occurs when sound waves enter a material and their energy is converted into a small amount of heat, reducing the sound’s intensity.
- Materials: Soft, porous materials such as foam, fabric, and fiberglass are effective at absorbing sound. These materials have numerous small air pockets that trap sound waves and dissipate their energy.
- Applications: Sound absorption is essential for reducing noise levels and preventing echoes in spaces such as recording studios, offices, and homes. Materials with high noise reduction coefficient (NRC) ratings are preferred.
- Sound Transmission:
- Concept: Transmission refers to the passage of sound waves through a material or partition into another space. The ability of a material to transmit sound depends on its density, thickness, and structure.
- Materials: Thinner, lighter materials transmit sound more easily, while dense, heavy materials such as concrete or mass-loaded vinyl impede sound transmission.
- Applications: Minimizing sound transmission is vital in creating soundproof environments. This is achieved by using materials with high sound transmission class (STC) ratings, which indicate better sound insulation properties.
- Engineering Design:
- Absorptive Materials: Acoustic panels, carpets, and ceiling tiles are used to absorb sound and reduce noise levels within a room.
- Reflective Surfaces: Strategic placement of reflective surfaces can enhance sound clarity in auditoriums and concert halls.
- Soundproof Barriers: Using dense, multilayered walls and floors, and sealing gaps and joints, are methods to block sound transmission between rooms.
Students will apply these principles to design and test a soundproofing system. By understanding how sound waves behave and how different materials and techniques can mitigate sound transmission, they will be able to create effective solutions and evaluate their performance scientifically.
Arduino
Arduino is an open-source electronics platform that uses hardware and software to create interactive electronic objects. Arduino boards can read inputs, such as light from a sensor, a button press, or a message, and turn them into outputs, such as activating a motor, turning on an LED, or publishing something online.
Arduinos are made up of the following parts and interfaces on a single circuit board:
- Pins: Used to connect with various components
- Analog pins: Can read a range of values
- Microcontroller: The primary chip that allows you to program the Arduino
- Serial connector: Allows you to communicate to the board from your computer
Arduinos are popular with tinkerers, hobbyists, and makers because of their versatility, affordability, and integration capabilities. They have been used in thousands of projects, including robotics, security, music, low-cost scientific instruments, interactive prototypes, installations, and Maker Faire projects.
The Arduino project began in 2005 as a tool for students at the Interaction Design Institute in Ivrea, Italy. Arduino uses a variant of the C++ programming language, with special methods and functions added. For suggested resources for Arduino beginners, see Troubleshooting Tips.
Before the Activity
- Arrange and set up materials for easy student access.
- Have students download the tone generator and Decibel X: dB, dBA Noise Meter apps on their smartphones.
- Make copies of the Noise Data Summary and Analysis Sheet (one per student).
- Ask students to determine their null and alternative hypotheses for this study.
During the Activity
DAY 1: Gathering Sound Data Without Soundproof Materials
Without Arduino:
- Introduce the activity and the design challenge, and have students determine their null and alternative hypotheses.
- Divide the class into groups of three or four students.
- Optional: Student roles for accountability:
- Team facilitator – Students in this role provide the team with instructions and help with time management, ensuring every member works efficiently, stays on task, and meets all required steps of the experiment. The team facilitator also serves as the supply manager, who gathers all the materials needed for the experiment.
- Technician – Students in this role are the main “hands” for the activity and do most of the building, mixing, or other tactile work (based on directions from the project manager).
- Data analyst – Students in this role record and analyze the data generated by the team. This person is in charge of getting everyone’s mathematical thinking in formulating and testing the hypothesis.
- Reporter – Students in this role communicate the team’s findings or present the team’s design to the rest of the class or audience. In this role, students summarize results, determine how to best share their design, and create presentation materials.
- Have each team set up their experiment testing station, as shown in Figure 1.
- Each experiment station should have one smartphone equipped with the sound meter app, another smartphone with the tone generator app, and a speaker. The sound meter app will measure the loudness of the sound, while the tone generator app will play a sound at constant volume.
- Create a rectangular figure with the same area as the base of the box used for the prototype. This will maintain a constant distance between the sound source and the containers, since sound intensity decreases with distance.
- Use masking tape to mark where students must center their prototype, as well as the boundary area. Ensure that the speaker does not move. Tape it down or mark where you should place the speaker for testing each time, if necessary.
- Have each team test with their box face down on the table and do the following:
- Put one phone inside the box with the sound meter app to measure the sound generated from the tone generator.
- Place the box face-down on the table.
- Use the speaker outside the box. See Figure 1.

- Show teams how to test and record their data.
- Play a noticeable sound louder than noise in the classroom on the tone generator app, and make sure this remains constant for 30 seconds.
- Simultaneously, click on the play button of the sound meter app. This app only records 30-second sound data.
- After gathering data, click on the “download” icon in the app, and then the “waffle” icon.
- Then click on the download button and download as a CSV file. See Figure 2.
- The most convenient way to send data is through email.

- Have each team determine the sample size (number of elements in their data set) and then find the mean and standard deviation of the data set on the CSV file. Use this Noise Detection Data Sheet Template if needed.
- Have each student record the sample size, mean, and standard deviation on their Noise Data Summary and Analysis Sheet. (See the Data Analysis Demo Spreadsheet for example answers.)
With Arduino: (Note: An additional day may be needed for this, as students need time to develop codes.)
Students mostly follow the steps above, BUT instead of using the sound meter app, students will use Arduino.
- Follow steps 1-3.
- Have each team set up their experiment testing station as follows:
- Set up the breadboard with the sound sensor as shown in Figure 3.

- Put the Arduino board inside the box and then place the box face-down on the table.
- Place the speaker outside the box and connect the Arduino board to the laptop/computer. See Figure 4.
 enclosed in a plastic container, while a Bluetooth speaker provides the sound source.")
- On their computer, open Arduino IDE and create a new sketch.
- Code the Arduino. Students have three options when coding, depending on their Arduino programming background knowledge. (Note: The Arduino board’s memory is persistent. This means that when the board is plugged into a computer it will immediately start executing the last code uploaded to the board. If the board is being used for multiple classes, blank code can be uploaded to the boards at the end of a class to start the next class off fresh.)
- Option 1: Copy the fully developed code from the Code File.
- Option 2: Fill in the blanks in the code by using the Fill-In-The-Blank Code Sheet.
- Option 3: Develop the code from scratch, making sure that the reading will reflect sound decibel reading. Thus, students need to convert ADC reading to decibel reading. Please see the formulas above.
- Start running the program and begin collecting data. The data in the serial monitor from code options 1 and 2 will be outputted in 10 rows of 15 data points similar to Figure 5.
, indicating the fluctuating sound levels recorded over time.")
- Move data into either Microsoft Excel or Google Sheets by copying and pasting the block of data. When pasted into either program, the data will be in 10 rows but only 1 column.
- Disperse the data...
- in Excel, keep the cells highlighted, click the “data” tab at the top, then click the “Text to Columns” button; this will pop up a prompt window. In the window, select the “Delimited” option, press next, then select “Comma” as a delimiter, and press finish. See Figure 6.

- In Google Sheets, keep the cells highlighted, click the “data” tab at the top, then click the “Split Text to Columns” button on the drop-down menu. This should automatically disperse the data, but if the data is still in 1 column, change the delimiter from “Detect Automatically” to “Comma”. See Figure 7.

- Have each team determine the sample size (number of elements in their data set) and then find the mean and standard deviation of the data set. You may also ask them to calculate them by hand and then verify with technology.
- Have each student record the sample size, mean, and standard deviation on their Noise Data Summary and Analysis Sheet.
DAYS 2 and 3: Building the Soundproof System Prototype With Less Expensive Materials and Data Collection
- Optional: Go over the steps of the engineering design process.
- Explain the design challenge to the students: They have two days to build their prototype using different materials and collecting data.
- Before they begin, remind them of the activity’s goal and the concepts of soundproofing to make the best decisions as to which materials to test.
- Give students time to brainstorm and plan their prototypes with the less expensive materials.
- Give students time to build their prototype.

- Have students use the same procedure to collect data as they did on Day 1, but this time with the prototype they created using the less expensive soundproof materials.
- Have students test their less expensive prototype using Microsoft Excel or Google Sheet to find the mean and standard deviation of each prototype. You may also ask them to calculate them by hand and then verify with technology. Then record them on the Noise Data Summary and Analysis Sheet.
DAY 4: Collecting Sound Data with More Costly Soundproof Materials
- There are three types of “more expensive” materials. Assign one to a group.
- Give students time to brainstorm and plan their prototypes with the more expensive materials.

- Give students time to build their prototype.
- Have students use the same procedure to collect data as they did on Day 1, but this time with the prototype they created using the more costly soundproof materials.

- Have each team test their assigned material and then use Microsoft Excel or Google Sheet to find the mean and standard deviation of each. Then record them on the Noise Data Summary and Analysis Sheet.
DAYS 5 and 6: Hypothesis Testing and Creating the Presentation
- Have students conduct hypothesis tests on the following:
- Without soundproofing materials and with less expensive materials
- Without soundproofing materials and with more expensive materials
- A less expensive material with a more expensive material
- Have students show their calculations on this Hypothesis Tests Worksheet.
- Have students give their conclusion with mathematical evidence.
- Allow each group to start creating a presentation about their prototype, findings, and recommendation.
DAY 7: Panel Presentation
- Invite experts to your classroom to be part of the panel. The panel may include an acoustic engineer, a mechanical engineer or professor, a software developer (if Arduino will be utilized), a building administrator, and/or a science professor.
- Provide the panel with the Soundproof System Engineering and Presentation Rubric.
- Have each team present their engineering product, data findings and analysis, conclusion, and recommendation.

- Allow the panel to ask questions and provide feedback.
Vocabulary/Definitions
alternative hypothesis: Often denoted as HA or H1; one of the proposed propositions in the hypothesis test. In general, the goal of a hypothesis test is to demonstrate that in the given condition, there is sufficient evidence supporting the credibility of the alternative hypothesis instead of the exclusive proposition in the test.
decibel: A relative unit of measurement that expresses the ratio of two values of a power or root-power quantity on a logarithmic scale.
hypothesis testing: A method of statistical inference used to decide whether the data sufficiently supports a particular hypothesis.
mean of a data set: Also referred to as the average; a measure of central tendency; the sum of all the values divided by the number of values in the dataset.
null hypothesis: Often denoted as H0; the claim that the effect being studied does not exist.
p-value: The probability of finding a test statistic that is more extreme than what was observed in the data, if the null hypothesis is true.
sample size: The number of data points or observations being used for statistical analysis.
sound absorption: A property of a material to take in energy when encountering a sound wave, as opposed to reflecting the energy. Some of the sound energy travels through the material while some is ‘lost’ in the material and turns into heat.
sound reflection: A property of a material to bounce or return energy when a soundwave is encountered, instead of absorbing it.
sound reverberation: The persistence of sound after it is produced. Reverberation is created when a sound or signal is reflected; this causes numerous reflections to build up and then decay as the sound is absorbed by the surfaces of objects in space.
sound transmission: When sound waves travel through a material or between materials.
soundproofing: Any method of reducing sound propagation. This can be done through changing the sound absorption or reflection of an object, by decreasing the sound transmission between materials, or other methods.
soundwaves: The vibration created as sound travels. Sound waves can have different amplitudes and frequencies, and they must have a medium to travel through.
standard deviation: A measure of dispersion, or how far observations are from the mean.
statistical significance: Refers to the probability that a difference between observed results and what would be expected by chance (under the null hypothesis) is truly due to a real effect, not randomness. Typically, a result is considered statistically significant if the probability of it happening by chance is less than a chosen threshold (often 5%).
Assessment
Pre-Activity Assessment
Activating Prior Knowledge Through Vertical Learning (students need to be standing up and working on a vertical whiteboard or chart paper): In their learning teams, students brainstorm ideas on the following prompts and write their ideas on the whiteboard or chart paper.
- Think Tank Time! How can we design a soundproofing system that effectively reduces noise in different environments, like a busy street, a loud classroom, or even a recording studio? Justify your reasoning using scientific evidence.
- Testing, Testing... Once we have our designs, what methods could we use to test how well they block sound?
- Stat Attack! How can we use statistical analysis to measure the effectiveness of our soundproofing solutions and see if they truly minimize noise levels?
Activity Embedded (Formative) Assessment
Collaborative Work: Together, teams gather sound data. Then they calculate the mean and standard deviation of their data set and determine the sample size. Before inputting this information on the Noise Data Summary and Analysis Sheet, ask students to show you their data set and calculations first so you can provide feedback if necessary.
Think-Write-RoundRobin With Hypothesis Testing: When all information needed to conduct hypothesis tests is ready, ask students to individually test their team’s hypothesis, then share their findings with their team. Use a structure called Think-Write-RoundRobin. Students may write their calculations on a paper or tagboard. When everyone in the team agrees on the accurate test, calculations, and conclusion, have them write their work on a whiteboard.
Carousel Feedback: When all teams are done, do Carousel Feedback. Ask teams to rotate from one whiteboard to another to provide feedback on other teams’ hypothesis tests and conclusions. Have them write their feedback on sticky notes. Encourage both positive feedback and opportunities for growth.
Team Calculation and Conclusion: After getting feedback, each team will transfer their work to the Hypothesis Tests Worksheet.
Post-Activity (Summative) Assessment
Engineering Product Presentation: Learning teams present their engineering design and product, data collection and analysis, hypothesis tests and conclusion, and recommendations. The Soundproof System Engineering and Presentation Rubric will be used.
Safety Issues
- Electrical Safety:
- Avoid Water: Keep all electronic components and wiring away from water and moisture.
- Proper Handling: Handle the Arduino and other electronic components with care to avoid short circuits.
- Power Off: Always disconnect the power supply before making any changes to the wiring or components.
- Tool Safety:
- Use Proper Tools: Use appropriate tools for cutting, drilling, or assembling materials, and handle them with care.
- Safety Gear: Wear safety goggles and gloves when working with tools to protect from debris and sharp edges.
- Sound Safety:
- Hearing Protection: When testing high sound levels, wear ear protection to prevent hearing damage.
- Volume Control: Ensure that the sound levels used during testing are within a safe range to avoid causing discomfort or damage to hearing.
- Material Safety:
- Non-Toxic Materials: Use non-toxic, safe materials for building the soundproofing system.
- Ventilation: Work in a well-ventilated area when using adhesives or paints to avoid inhaling fumes.
- General Safety:
- Supervision: Ensure that an adult or instructor is present during the project to provide guidance and handle any emergencies.
- First Aid: Keep a first aid kit nearby in case of minor injuries.
- Emergency Procedures: Be aware of the location of emergency exits and procedures in case of an accident.
Troubleshooting Tips
- Sound Meter App Inaccurate Reading
- Calibration: Ensure the app is calibrated correctly.
- Microphone Quality: Note that smartphone microphones vary in quality; use the same device throughout the project to maintain consistency. Also, maintain the distance between devices and setup.
- Environmental Factors: Minimize background noise and wind interference when taking measurements.
- Sound Meter App Malfunction
- Restart App: Close and restart the app if it stops responding.
- Update App: Ensure the app is up to date, as updates may fix bugs and improve accuracy.
- Device Restart: Restart the smartphone if the app continues to malfunction.
- Data Logging Issues:
- Storage Permissions: Make sure the app has the necessary permissions to save data. The free version of the Decibel X:dB app allows users to store one set of data at a time.
- Exporting Data: Learn how to export data from the app (e.g., CSV files) for further analysis.
- Consistent Usage: Use the same settings and procedures each time you measure to ensure consistent data collection.
- Arduino Not Powering On:
- Check Connections: Ensure that all cables are securely connected.
- Power Source: Verify that the Arduino is properly connected to a power source, either via USB or an external power supply.
- Reset Button: Press the reset button on the Arduino board to restart it.
- Sensor Not Detecting Sound:
- Wiring: Double-check the wiring connections between the sensor and the Arduino.
- Code: Ensure that the code uploaded to the Arduino is correct and includes proper commands for reading from the sound sensor.
- Sensitivity: Adjust the sensitivity of the sound sensor if it has an adjustable potentiometer.
- Inaccurate Data Readings:
- Calibration: Calibrate the sound sensor to ensure accurate measurements.
- Environmental Factors: Minimize external noise and vibrations that could affect readings.
- Code: Review the code to ensure it correctly processes and records data.
- Data Not Logging Correctly:
- Serial Monitor: Use the Arduino serial monitor to debug and check whether data is being correctly sent to the logging device.
- Soundproofing Not Effective:
- Materials: Re-evaluate the materials used for soundproofing and ensure that they are appropriate for absorbing or blocking sound.
- Construction: Check for gaps or weaknesses in the construction that might allow sound to pass through.
- Testing Method: Verify that the testing method is consistent and accurate.
Activity Extensions
- As a class, decide which soundproof prototype is the most effective one based on mathematical evidence.
- Ask students to build a small soundproof compartment in your classroom using the chosen prototype.
- Work with professionals as their advisors.
Activity Scaling
For lower grades:
- Data collected from this module may be used to find the measures of centers (mean, median, mode) and measures of dispersion (range, interquartile range, standard deviation).
- Represent data in a bar graph, histogram, and other graphical representations.
- Data may also be used to create a scatter plot but add some other variable that could possibly affect sound levels (e.g., distance of the speaker from the box).
- Soundproof materials may be limited to less expensive ones.
For older/advanced students:
- Expand the concept with logarithmic functions.
- Provide more opportunities for programming, such as adding an alert system on the Arduino setup, creating a sound meter app using Arduino, and finding ways to use Arduino to benefit people with hearing issues.
- Experiment on other factors that could affect sound levels, such as distance and shape of the box, and use data for other statistical analysis such as Pearson correlation.
Subscribe
Get the inside scoop on all things Teach Engineering such as new site features, curriculum updates, video releases, and more by signing up for our newsletter!More Curriculum Like This

Students are introduced to the technology of flexible circuits, some applications and the photolithography fabrication process. They are challenged to determine if the fabrication process results in a change in the circuit dimensions since, as circuits get smaller and smaller (nano-circuits), this c...

Students act as engineers as they design, build, and test a smart prosthetic grip system using Arduino, a force-sensitive resistor (FSR), and a servo motor. Students construct a prosthetic finger or hand from materials of their choice and program it to move through different angles of motion, modeli...

Other Related Information
Resources for Arduino Beginners:
- Official Arduino Resources
- Arduino Website: The official Arduino website is the best starting point. It offers comprehensive guides, documentation, and downloads.
- Arduino Getting Started Guide: This guide walks you through setting up your Arduino board, installing the IDE, and writing your first program.
- Arduino IDE: Download the official Arduino Integrated Development Environment (IDE) for programming your boards.
- Online Tutorial and Courses
- Arduino Project Hub: A collection of community-contributed projects and tutorials. Great for inspiration and learning through hands-on projects.
- Adafruit Learning System: Offers detailed tutorials and guides for a variety of Arduino projects, from basic to advanced.
- Instructables: A platform where makers share detailed guides and tutorials on Arduino projects.
- Coursera: Coursera offers a course on "Introduction to Programming the Internet of Things (IoT) Specialization," which includes a module on Arduino.
- University of Kansas Human Motion Control Laboratory: This site has a plethora of resources for K-12 teachers that include Arduino instructional videos.
- YouTube Channels and Chatbot
- Arduino: The official Arduino YouTube channel provides tutorials, project ideas, and updates.
- Paul McWhorter: Paul McWhorter offers a popular series of Arduino tutorials for beginners.
- Jeremy Blum: Jeremy Blum's channel includes comprehensive tutorials and project videos.
- Arduino Chatbot: Created by Dr. Sara Wilson of the University of Kansas, this chatbot is designed to simulate conversations with human users about Arduino.
Copyright
© 2025 by Regents of the University of Colorado; original © 2025 University of KansasContributors
Cherryl Delacruz, 6-12 Math Consulting Teacher, Topeka Public Schools; Riley Hoffer, Engineering and Teaching Undergraduate, University of Kansas; Esraa Abdelsalam, Program Assistant, University of Kansas ; Dr. Prajna Dhar, Professor and Director of Graduate Studies Department of Chemical and Petroleum Engineering, University of Kansas; Riley Hoffer, Engineering and Teaching Undergraduate, University of Kansas ; Dr. Douglas Huffman, Professor of Science Education, University of Kansas; Nafiseh Mohammadianaftah, Graduate Mechanical Engineering Student, University of Kansas; Dr. Meagan Patterson, Professor Department of Educational Psychology, University of Kansas; Morgan Vannoy, Graduate Research Assistant Department of Educational Psychology, University of Kansas; Dr. Sara Wilson, Associate Professor and Graduate Director Mechanical Engineering, University of KansasSupporting Program
IDEA-BioE RET Program through the University of KansasAcknowledgements
This material is based upon work supported by the National Science Foundation under grant no. ECC-2055716 - a Research Experience for Teachers program titled Inquiry-Driven Engineering Activities using Bioengineering (IDEA-BioE) at the University of Kansas. Any opinions, findings and conclusions or recommendations expressed in this material are those of the author(s) and do not necessarily reflect the views of the National Science Foundation.
Last modified: January 14, 2026
User Comments & Tips