Quick Look
Grade Level: 8 (7-9)
Time Required: 30 minutes
Expendable Cost/Group: US $0.00
Group Size: 0
Activity Dependency:
Subject Areas: Algebra

Summary
Students explore the definition of a function by playing an interactive game called "Club Function." The goal of the game is to be in the club! With students each assigned to be either a zebra or a rhinoceros, they group themselves according to the "rules" of the club function. After two minutes, students freeze in their groups, and if they are not correctly following the rules of the club function, then they are not allowed into the "club." Through this activity students come to understand that one x-coordinate can only have one corresponding y-coordinate while y-coordinates can have many x-coordinates that correspond to it.Engineering Connection
Engineers must understand functions in order to represent real-world phenomena using mathematics. Much of engineering employs mathematics in modeling and predicting relationships between variables, and the function is one of the most important concepts in mathematics. This activity focuses on linear equations, which are the basis for many simple, yet important concepts within engineering.
Learning Objectives
After this lesson students should be able to:
- State the definition of a function.
- Identify non-functions and explain their flaws by talking about x and y coordinates.
- Create their own mapping diagram from a set of names from the activity or coordinates from the coordinate plane.
Educational Standards
Each TeachEngineering lesson or activity is correlated to one or more K-12 science,
technology, engineering or math (STEM) educational standards.
All 100,000+ K-12 STEM standards covered in TeachEngineering are collected, maintained and packaged by the Achievement Standards Network (ASN),
a project of D2L (www.achievementstandards.org).
In the ASN, standards are hierarchically structured: first by source; e.g., by state; within source by type; e.g., science or mathematics;
within type by subtype, then by grade, etc.
Each TeachEngineering lesson or activity is correlated to one or more K-12 science, technology, engineering or math (STEM) educational standards.
All 100,000+ K-12 STEM standards covered in TeachEngineering are collected, maintained and packaged by the Achievement Standards Network (ASN), a project of D2L (www.achievementstandards.org).
In the ASN, standards are hierarchically structured: first by source; e.g., by state; within source by type; e.g., science or mathematics; within type by subtype, then by grade, etc.
Common Core State Standards - Math
-
Understand that a function is a rule that assigns to each input exactly one output. The graph of a function is the set of ordered pairs consisting of an input and the corresponding output.
(Grade
8)
More Details
Do you agree with this alignment?
International Technology and Engineering Educators Association - Technology
-
Explain how knowledge gained from other content areas affects the development of technological products and systems.
(Grades
6 -
8)
More Details
Do you agree with this alignment?
State Standards
National Council of Teachers of Mathematics - Math
-
Use mathematical models to represent and understand quantitative relationships
(Grades
Pre-K -
12)
More Details
Do you agree with this alignment?
Materials List

Worksheets and Attachments
Visit [www.teachengineering.org/activities/view/van_linear_eqn_act_less2] to print or download.Pre-Req Knowledge
Familiarity with the coordinate plane, coordinates and equations are helpful but not required.
Introduction/Motivation
(Prepare to show students the attached Linear Functions Presentation PowerPoint file, which is composed of three sections, delineated by three different slide background colors [blue, gray, gold]. Slides 1-8 are covered in the associated lesson. For this activity, show students slides 4-11 as you present the Introduction/Motivation section.)
(In order to relate this activity to the grand challenge in this unit, explain that the equations provided by the undergraduate student may represent a function that can tell us about the data gathered in the lab. If these equations are functions, important conclusions may be made regarding the relationships between the variables measured. Engineers employ mathematics to help model and predict what will happen in real-world phenomena. This activity provides practice with the concept of functions so students can use that concept to examine the data.)
(As necessary, review with students the content on slides 4-8.)

(The most important concept is the idea that one x-coordinate can only have one corresponding y-coordinate. Yet, y-coordinates can have many x-coordinates that correspond to it. In this game, zebras are "x-coordinates" and rhinos are "y-coordinates." This will be demonstrated when the teacher "maps" each group to check to see if they are allowed in the club function.)
(Show students slides 9-11 to explain the game and rules:)
A function is a term used to describe a group of coordinates that follow a certain set of rules. The rules are that the first element in the set (like the zebras) are paired with exactly one element of the second set (rhinos). It does not say that elements of the second set have to pair with exactly one element of the first set, so it is okay if there is some overlap in the second set. This can be described as one-to-one: there is one y-coordinate for every one x-coordinate.
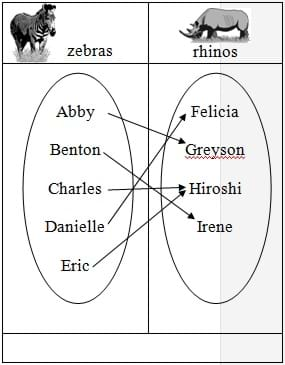
In our example, zebras are like x's and rhinos are like y's. There must be exactly one y for every x and at least one x for every y. So if we wanted to, we could write our mapping diagram as a set of points that is a function. (Use the classroom board to show the following example.) This would look like {(Abby, Greyson), (Benton, Irene), (Charles, Hiroshi), (Danielle, Felicia), (Eric, Hiroshi)}. See how the first element, the zebras/x's, only appears once? And Hiroshi appears twice for the rhinos/y's, but that's okay because every y must be paired with AT LEAST one x. It's okay if there is more than one, like Charles and Eric.
(Go through some examples of functions and non-functions in several formats [mapping diagrams, sets of points, graphs] and have students tell you whether they are functions or not.)
There is a special name for the x-elements of a group of coordinates. It is called the domain. The y-elements also have a special name, the range. So in our mapping diagram example, the domain is {Abby, Benton, Charles, Danielle, Eric} and the range is {Felicia, Greyson, Hiroshi, Irene}. (Go over some more examples of domain and range and have students define the domain and range of certain sets of points [in algebraic and graphic forms].)
Procedure
After introducing the game and rules (see the Introduction/Motivation section), follow these steps.
- The teacher hands each student a card with a picture of a zebra or rhinoceros on it.
- Students have two minutes to organize into groups based on the rules of the club function.
- When time is up, the teacher draws a mapping of each group on the board to check to see if the club function rules are followed.
- If a group does not follow the rules, then all the students get another two minutes to form new groups based on the club function rules. (If the students all follow the rules the first time, a second trial is not needed). Be sure to not erase any of the groupings before the next round to give students a chance to understand what is wrong with the groups not allowed into the club function.
- When time is up, the teacher again draws a mapping of each group on the board to check to see if the club function rules are followed. If all of the rules are followed, the students can take a seat while the teacher explains the mapping and explanation of functions. (See the Introduction/Motivation section for detailed mapping explanation).
- Challenge the students by switching the rules. What would happen to their maps and groups if zebras represented the y-coordinates and rhinos represented the x-coordinates?
Assessment
Journal Questions: After the game is over, assign students to answer the following questions in their journals to turn in at class end:
- How would you define a function?
- List a group of coordinates or a mapping of people that could create a function.
- List a group of coordinates or a mapping of people that would not be considered a function.
- Why do you think engineers need to understand functions?
Subscribe
Get the inside scoop on all things Teach Engineering such as new site features, curriculum updates, video releases, and more by signing up for our newsletter!More Curriculum Like This

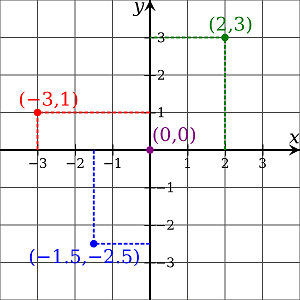
A brief refresher on the Cartesian plane includes how points are written in (x, y) format and oriented to the axes, and which directions are positive and negative. Then students learn about what it means for a relation to be a function and how to determine domain and range of a set of data points.

Students learn about linear programming (also called linear optimization) to solve engineering design problems. They apply this information to solve two practice engineering design problems related to optimizing materials and cost by graphing inequalities, determining coordinates and equations from ...
Copyright
© 2013 by Regents of the University of Colorado; original © 2007 Vanderbilt UniversityContributors
Aubrey McKelveySupporting Program
VU Bioengineering RET Program, School of Engineering, Vanderbilt UniversityAcknowledgements
The contents of this digital library curriculum were developed under National Science Foundation RET grant nos. 0338092 and 0742871. However, these contents do not necessarily represent the policies of the NSF, and you should not assume endorsement by the federal government.
Last modified: September 5, 2017


User Comments & Tips