Quick Look
Grade Level: 11 (9-11)
Time Required: 4 hours 30 minutes
(55 minutes on five different days)
Expendable Cost/Group: US $0.50 This activity requires some non-expendable (reusable) supplies, such as sensors, multimeters, screwdrivers, battery holders, batteries, wire connectors, alligator clips, suction cup hooks, and screw eyes, ~$65 per group; see the Materials List for details.
Group Size: 3
Activity Dependency: None
Subject Areas: Geometry
Summary
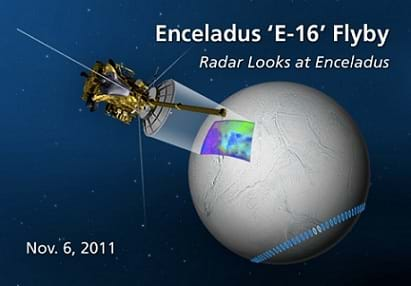
Students learn the importance of the Pythagorean theorem as applied in radar imaging. They use a sensor unit with IRED (infrared emitting diode) to measure triangle distances and the theorem to calculate and verify distances. Student groups calibrate the sensor units to ensure accurate distance measurements. A "pretend" outdoor radar imaging model is provided to groups for sensor unit testing.Engineering Connection
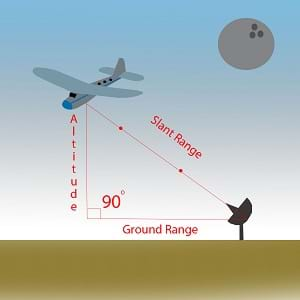
Math, science and engineering play an indisputable role in the creation of modern measuring devices. Without some of these devices, it would be extremely difficult or even impossible to measure distances due to bad weather, hostile territory or remote location. Examples devices include synthetic aperture radars (SAR) developed by electrical engineers. SAR systems use radio waves and echoes to measure slant range (distance from radar to target) and ground range (horizontal or ground distance from radar to target). SAR technology provides structural terrain information for mineral exploration, reconnaissance and targeting information for military operations, and oil spill boundaries on water to help with clean-up. A right triangular model can be used to illustrate the distance relationships formed from the radar, target and targets altitude. Similar to SARs, we can use the geometric concept of the Pythagorean theorem to calculate the distances in any right triangle model. Without an accurate measurement of distance, SARs would not be able to produce high-resolution images of remote locations.
Learning Objectives
After this activity, students should be able to:
- Demonstrate a basic understanding of a synthetic aperture radar (SAR) system.
- Formulate a tabular and graphical model that describes the relationship between variables.
- Use the Pythagorean theorem to calculate side lengths of right triangles.
Educational Standards
Each TeachEngineering lesson or activity is correlated to one or more K-12 science,
technology, engineering or math (STEM) educational standards.
All 100,000+ K-12 STEM standards covered in TeachEngineering are collected, maintained and packaged by the Achievement Standards Network (ASN),
a project of D2L (www.achievementstandards.org).
In the ASN, standards are hierarchically structured: first by source; e.g., by state; within source by type; e.g., science or mathematics;
within type by subtype, then by grade, etc.
Each TeachEngineering lesson or activity is correlated to one or more K-12 science, technology, engineering or math (STEM) educational standards.
All 100,000+ K-12 STEM standards covered in TeachEngineering are collected, maintained and packaged by the Achievement Standards Network (ASN), a project of D2L (www.achievementstandards.org).
In the ASN, standards are hierarchically structured: first by source; e.g., by state; within source by type; e.g., science or mathematics; within type by subtype, then by grade, etc.
International Technology and Engineering Educators Association - Technology
-
A prototype is a working model used to test a design concept by making actual observations and necessary adjustments.
(Grades
9 -
12)
More Details
Do you agree with this alignment?
-
Identify the design problem to solve and decide whether or not to address it.
(Grades
9 -
12)
More Details
Do you agree with this alignment?
-
Evaluate the design solution using conceptual, physical, and mathematical models at various intervals of the design process in order to check for proper design and to note areas where improvements are needed.
(Grades
9 -
12)
More Details
Do you agree with this alignment?
-
Evaluate final solutions and communicate observation, processes, and results of the entire design process, using verbal, graphic, quantitative, virtual, and written means, in addition to three-dimensional models.
(Grades
9 -
12)
More Details
Do you agree with this alignment?
-
Illustrate principles, elements, and factors of design.
(Grades
9 -
12)
More Details
Do you agree with this alignment?
-
Determine the best approach by evaluating the purpose of the design.
(Grades
9 -
12)
More Details
Do you agree with this alignment?
-
Synthesize data and analyze trends to make decisions about technological products, systems, or processes.
(Grades
9 -
12)
More Details
Do you agree with this alignment?
-
Assess a technology that minimizes resource use and resulting waste to achieve a goal.
(Grades
9 -
12)
More Details
Do you agree with this alignment?
State Standards
Texas - Math
-
use trigonometric ratios to calculate distances and angle measures as applied to fields.
(Grades
9 -
12)
More Details
Do you agree with this alignment?
-
communicate mathematical ideas, reasoning, and their implications using multiple representations, including symbols, diagrams, graphs, and language as appropriate;
(Grades
9 -
12)
More Details
Do you agree with this alignment?
-
solve geometric problems involving indirect measurement, including similar triangles, the Pythagorean Theorem, Law of Sines, Law of Cosines, and the use of dynamic geometry software;
(Grades
9 -
12)
More Details
Do you agree with this alignment?
Texas - Science
-
design and implement investigative procedures, including making observations, asking well-defined questions, formulating testable hypotheses, identifying variables, selecting appropriate equipment and technology, and evaluating numerical answers for reasonableness;
(Grades
9 -
12)
More Details
Do you agree with this alignment?
-
express and manipulate relationships among physical variables quantitatively, including the use of graphs, charts, and equations.
(Grades
9 -
12)
More Details
Do you agree with this alignment?
-
organize and evaluate data and make inferences from data, including the use of tables, charts, and graphs;
(Grades
9 -
12)
More Details
Do you agree with this alignment?
Materials List
Each group needs:
- Sharp® GP2Y0A02YK0F Sensor, for $14.50, available from Acroname Robotics at http://www.acroname.com/robotics/parts/R144-GP2Y0A02YK.html
- 4 AA battery holder with cover and switch, for $2, available from Pitsco Education at https://www.pitsco.com/AA-Battery-Holders-with-Cover-and-Switch?SKU=32971&
- 4 AA alkaline batteries, for $2 per pair, available from Pitsco Education at https://www.pitsco.com/Batteries?SKU=51046&
- mini multimeter, for $24, available from Pitsco Education at https://www.pitsco.com/Mini-Multimeter?SKU=31912&
- 2 #4-40 x 3/4 screws, such as product #1170 for 12¢, with 2 combo hex nuts, available from Bolt Depot at https://www.boltdepot.com/Product-Details.aspx?product=1170; also available for 7¢ from Bolt Depot at https://www.boltdepot.com/Product-Details.aspx?Units=US&Category=Nuts&Subcategory=Hex_machine_screw_nuts&Material=Brass&Plating=&Grade=&Finish=&Thread_direction=Right_hand&Thread_density=Coarse&Diameter=%234&Thread_count=40&nv=rel
- 2 wire connectors, such as a 25-pack, available from Lowes at https://www.lowes.com/pd/IDEAL-25-Pack-Plastic-Wing-Wire-Connectors/1000138283
- alligator clips, such as from Lowes at https://www.lowes.com/pd/Utilitech-16-Count-Disconnects-Wire-Connectors/999953182
- 2 clear suction hooks, available from Home Depot at https://www.homedepot.com/p/OOK-2-Pack-Press-Mount-Suction-Cup-533897/206177685
- precision screwdriver, for $9 per set, available from Lowes at https://www.lowes.com/pd/IRWIN-Precision-5-Piece-Screwdriver-Set/1000234943
- zip lock bag or plastic produce bag, to organize group materials as a "kit"
To share with the entire class:
- screw eyes, for $3.50 per box of 100, available from Pitsco Education at https://www.pitsco.com/Standard-Screw-Eyes?SKU=15109&
- masking tape
- ruler
- fishing line or string, for a finishing line
Worksheets and Attachments
Visit [www.teachengineering.org/activities/view/utpa_perfectwaves_activity1] to print or download.Pre-Req Knowledge
Students should be very comfortable working with the following concepts: the distance formula, types of triangles, and relationships between measurement of triangle sides and angles. Students should have prior knowledge of the triangle inequality theorem and recognize the distance and angle relationships formed from the radar, target and target's altitude. (The triangle inequality theorem may be explained while teaching the Pythagorean theorem equation since the equation clearly shows that one side of a triangle is always shorter than the sum of the other two sides.) All concepts, with the exception of the triangle inequality theorem are not required, but enhance th students' learning experiences. Use the pre-requisite knowledge to scale the activity for higher levels.
Introduction/Motivation
(Before students enter the classroom, with the projector off and classroom lights dimmed, open the Catching the Perfect SAR Wave Presentation [a PowerPoint file] to the title slide. From the title slide, click on "Play Multimedia" located on the lower part of the slide. This link plays sounds being generated from radio emissions from Saturn.)
As you walked in the classroom, were you intrigued by the sounds? What might these sounds be? What type of animals, instruments or natural phenomena might be making these sounds? (Give students to time to brainstorm ideas. Encourage them to use their imaginations. Turn on the classroom lights and have students share their ideas. After some guesses have been presented to the entire class, turn off the sounds.) Believe it or not, the sounds you heard are radio emissions coming from Saturn!
How is it possible to hear something from such a very great distance? (Expected responses: Baby monitors, telephones, two-way radios, antennas, satellites, and car radio and stereo.) You are all correct and all these devices use waves as the medium for sound! Is it possible to see an object far away with something blocking your view? (Student might take a little bit longer to answer, but expect answers such as: airport body scanners, MRI scanners, medical x-rays, and thermal imaging. Great, these are also all correct! Today we will be focusing on radar systems, which are used to see objects or topography from great distances. Radar systems also use waves as the medium to capture images. Radar imaging applications include examples such as military surveillance, terrain mapping and weather reporting. Radar imaging technology, developed by electrical engineers, provides structural terrain information to geologists for mineral exploration, reconnaissance and targeting information for military operations, and oil spill boundaries on water to environmentalists.
Today we will learn about the importance of the Pythagorean theorem in radar imaging systems! (At this point, start the presentation and let the journey of radar imaging begin.)
Procedure
Background
The Catching the Perfect SAR Wave Presentation provides the necessary background knowledge for the activity. The supplemental multimedia links on slides 4, 6 and 9 are strongly recommended, and it is suggested that teachers familiarizing themselves with these links before presenting them to students. The multimedia link on slide 2 requires java virtual machine plug-in. The slide 6 multimedia link takes you to the NASA Mission: Science website that contains an introductory video on the electromagnetic spectrum and individual waves. Slide 9 contains a direct link to an interactive radar image of Washington, DC. Please note that the multimedia might open in the background and you may need to switch over to your Internet browser. Radar diagrams and correct explanation of the geometry is crucial in order for students to make connections between concepts. Once you have completed the presentation with the class, distribute the Understanding the Problem Worksheet and have students complete the answers before beginning the hands-on activity.

Students follow a partial engineering design process, similar to the NASA engineering design process shown in Figure 1. During the introduction and accompanying presentation, students develop an understanding of the problem. In the last slide of the PowerPoint presentation, the problem is stated, but students may reference their notes to restate the problem in their own words. During the first two days of the activity, students work on step 2 of the design process as they learn about the components, tools and activity constraints. After students identify the criteria and constraints, they build a functional "radar" system prototype, notably step 7 of the design process. Finally, students refine their designs by examining and evaluating their prototypes on the third day, thereby completing step 8.
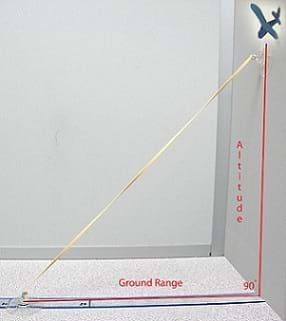
Pythagorean theorem equation: a2 + b2 = c2 where c represents the length of the hypotenuse (slant range) and a (altitude) and b (ground range) represent lengths of the other two sides of a right triangle. The hypotenuse c = (a2 + b2)^(1/2).
Before the Activity
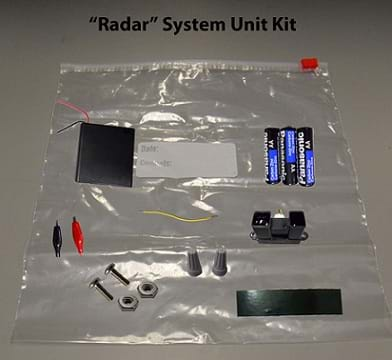
- In advance, prepare an activity kit for each group; this expedites the distribution process and helps students to focus on the activity and learning objectives. Make a kit by placing a sensor, battery holder, batteries, screw, hex nut, two wire connectors, two alligator clips, precision screwdriver and two-inch shield wires (obtained from excess wires from sensor) in a zip lock bag (or any type of clear plastic bag).
- Wall space or boxes are needed for the calibration of the "radar" system on day 2.
- Your class and group sizes determine the number of evaluation sites to prepare. Table 1 shows six set-up lengths for altitude and ground range. The altitude and ground range values represent the height and base of a right triangle. Students use the Pythagorean theorem to solve for an altitude or ground range (legs of a right triangle). Set up the evaluation sites after the completion of "Radar System Construction," preferably not during class time.
- To set up the evaluation sites, simply mark an altitude/height on a wall and corresponding ground range/base on the floor. At each marked location, place a clear plastic suction cup containing a screw eye on the top end. Connect both suction cups using a piece of fishing line or string. Tape a model airplane on top of the wall suction cups. Refer to Figures 2 and 3.
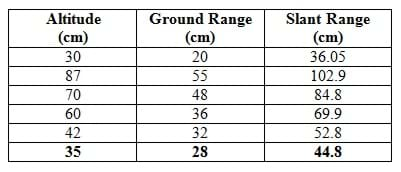
Table 1: Set-up lengths for the altitude and ground range, with corresponding slant ranges.
With the Students
Day 1:
(Note: Prior to day 1, students should have seed the PowerPoint presentation and and completed the worksheet.)
- Divide the class into groups of three students each.
- Distribute the "radar" system unit kits with all the materials to construct the "radar" system prototype.
- Have groups construct prototypes. Choose to walk the students step-by-step through the prototype construction or have them work on their own, collaboratively as a team. Refer to the Radar System Construction as a manual to construct the prototypes.
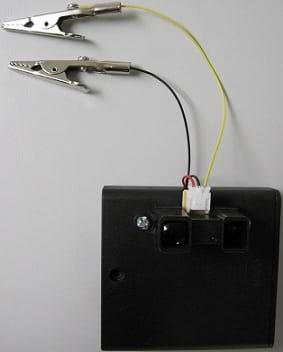
"Radar" system prototype.
Day 2:
(Note: By day 2, students should have completed construction of the "radar" system prototype.)
- Distribute multimeters and the Mathematical Model to each group. Have students use this worksheet to record results during the calibration.
- Assign each team member a role as follows: system keeper, system analyst and system maintenance leader. The system keeper holds on to the "radar" system while using the multimeter to obtain voltage readings. The system analyst uses the given template to record the voltage readings and distance of the system to the target (a box). The system maintenance leader is responsible for ensuring the target (wall or box) is aligned with the "radar" system. Explain to each role and model the set-up for system calibration.
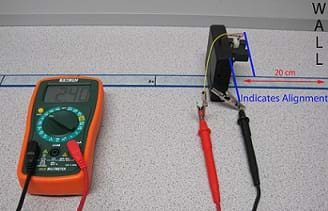
"Radar" system calibration set-up. - Use the Radar System Calibration as a manual for calibrating the prototypes.
- Expect student groups to complete the Mathematical Model during the calibration.
Day 3:
- Give each group a copy of the Radar System Evaluation. Identify the evaluation sites created with the corresponding number on the evaluation paper. Have students use the "radar" system and system calibration recordings to determine each missing distance. Have students take multiple readings within the allotted time. Readings may vary slightly according to personal calibration. Refer to the Sample Radar Voltage Readings.
- Direct students to use the Pythagorean theorem to verify that the missing distance captured by the "radar" system is correct.
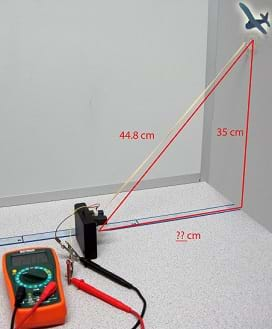
Indoor "radar" system evaluation with unknown ground distance, height of 35 cm, and hypotenuse of 44.8 cm.
Vocabulary/Definitions
altitude: The height of an object measured vertically from the ground.
antenna: The part of a radar system that propagates the produced rf (radio frequency) pulses.
backscatter: The reflected electromagnetic energy from an object. It is also called echo.
electromagnetic spectrum: The range of all possible frequencies of electromagnetic radiation.
frequency: The number of repetitions per unit of time; cycles per second.
ground range: The ground distance from a radar to a target.
radar: A radio detection and ranging system detects targets by reflected electromagnetic energy.
receiver: The part of a radar system that captures, amplifies and demodulates rf pulses.
slant range: The diagonal distance from a radar to a target.
transmitter: The part of a radar system that produces rf (radio frequency) pulses of energy.
wave: A continuous oscillation of energy in space time.
Assessment
Pre-Activity Assessment
Understanding the Problem: Have students complete the Understanding the Problem Worksheet, which is designed to reinforce their understanding about waves, the electromagnetic spectrum, radar systems and the Pythagorean theorem as it relates to engineering. At the end of the assessment, students are asked to restate their understanding of challenge/problem they are asked to solve in the activity.
Activity Embedded Assessment
A Mathematical Model: Have students complete the Mathematical Model, which provides a blank table and graph paper for student to collect and plot data. Student use their constructed sensor unit and record distance and the corresponding voltage reading. Independent and dependent variables are labeled on the table and graph.
Post-Activity Assessment
Radar System Evaluation: Have students complete the Radar System Evaluation, which is designed to evaluate students' knowledge of the Pythagorean theorem. They are given clipart of a radar, target and target's altitude, which all together form a triangular model. They use the Pythagorean equation with two known side lengths on the triangular model to calculate the missing side length.
Activity Extensions
Have students calculate the percent error of the distances obtains from reading voltages to the actual distances calculated using the Pythagorean theorem. The equation to determine the percent error can be found on the Radar System Evaluation.
Activity Scaling
- For lower grades, re-teach the Pythagorean theorem by working out examples for each side of a right triangle. Make sure students have the Pythagorean theorem recorded in their notes. You may also want to model each step of the radar system construction.
- For upper grades, give less guidance. After showing the presentation to provide students with background information, have them assemble the radar system with guidance from the manual. As part of their assessment, have students create evaluation sights using their sensors. You may also want to assign them more evaluation problems.
Subscribe
Get the inside scoop on all things Teach Engineering such as new site features, curriculum updates, video releases, and more by signing up for our newsletter!More Curriculum Like This

Students learn about radar imaging and its various military and civilian applications that include recognition and detection of human-made targets, and the monitoring of space, deforestation and oil spills. Students apply the critical attributes of similar figures to create scale models of a radar i...

Students learn about ultrasound and how it can be used to determine the shapes and contours of unseen objects. Using a one-dimensional ultrasound imaging device (either prepared by the teacher or put together by the students) that incorporates a LEGO® MINDSTORMS® EV3 intelligent brick and ultrasonic...
References
"Viewing Radio Waves." October 31, 2011. Teachers' Domain. Accessed June 28, 2012. http://www.teachersdomain.org/resource/npe11.sci.phys.energy.viewradiowaves/
Photo Dept. NASA Headquarters, 300 E. St. SW, Washington, DC 20546 http://saturn.jpl.nasa.gov/photos/imagedetails/index.cfm?imageId=4399
"Radio Waves & Electromagnetic Fields." Updated April 19, 2007. Teachers' Domain. Accessed June 29, 2012. http://www.teachersdomain.org/resource/hew06.sci.phys.energy.radiowaves
"The Electromagnetic Spectrum" Updated June 20, 2012. NASA Mission: Science. Accessed June 29, 2012. https://mynasadata.larc.nasa.gov/ElectroMag.html
"Video Tour of Electromagnetic Specturm." Updated June 20, 2012. NASA Mission: Science. Accessed June 29, 2012. http://missionscience.nasa.gov/ems/emsVideo_01intro.html/
"Imaging with Radar." Updated January 29, 2004. Teachers' Domain. Accessed June 29, 2012. http://www.teachersdomain.org/resource/phy03.sci.phys.energy.radar/
Copyright
© 2013 by Regents of the University of Colorado; original © 2012 The University of Texas-Pan AmericanContributors
Luis Avila; Mounir Ben GhaliaSupporting Program
RET-ENET Program, Electrical Engineering Department, The University of Texas-Pan AmericanAcknowledgements
This activity was created through The University of Texas-Pan American's Electrical Engineering Research Experiences for Teachers in Emerging and Novel Engineering Technologies (RET-ENET) Program with support from National Science Foundation grant no. CNS 1132609. However, these contents do not necessarily represent the policies of the National Science Foundation, and you should not assume endorsement by the federal government.
Last modified: August 8, 2025


User Comments & Tips