Quick Look
Grade Level: 6 (4-6)
Time Required: 45 minutes
Expendable Cost/Group: US $5.00
Group Size: 12
Activity Dependency: None
Subject Areas: Chemistry
NGSS Performance Expectations:

| MS-PS1-2 |
Summary
Using gumdrops and toothpicks, students conduct a large-group, interactive ozone depletion model. Students explore the dynamic and competing upper atmospheric roles of the protective ozone layer, the sun's UV radiation and harmful human-made CFCs (chlorofluorocarbons).
Engineering Connection
Many engineers invent new technologies and/or re-designed old technologies to entirely avoid producing harmful CFCs, which deplete the Earth's protective ozone layer. These changes to design, manufacturing processes, regulations and practices have reduced the US CFC emissions dramatically. Some changes included new types of refrigerator coolants and the elimination of many aerosol spray propellants. The modern engineer always keeps long-term sustainability in mind as a design objective.
Learning Objectives

After this activity, students should be able to:
- Understand and explain the different processes that destroy ozone in the Earth's atmosphere.
- Create an interactive model of ozone destruction.
- Compare a model of ozone with what it represents.
- Develop an understanding of the global trend towards ozone depletion and recovery.
- Collect data and create a graph of global ozone amounts over the last 50 years.
Educational Standards
Each TeachEngineering lesson or activity is correlated to one or more K-12 science,
technology, engineering or math (STEM) educational standards.
All 100,000+ K-12 STEM standards covered in TeachEngineering are collected, maintained and packaged by the Achievement Standards Network (ASN),
a project of D2L (www.achievementstandards.org).
In the ASN, standards are hierarchically structured: first by source; e.g., by state; within source by type; e.g., science or mathematics;
within type by subtype, then by grade, etc.
Each TeachEngineering lesson or activity is correlated to one or more K-12 science, technology, engineering or math (STEM) educational standards.
All 100,000+ K-12 STEM standards covered in TeachEngineering are collected, maintained and packaged by the Achievement Standards Network (ASN), a project of D2L (www.achievementstandards.org).
In the ASN, standards are hierarchically structured: first by source; e.g., by state; within source by type; e.g., science or mathematics; within type by subtype, then by grade, etc.
NGSS: Next Generation Science Standards - Science
| NGSS Performance Expectation | ||
|---|---|---|
|
MS-PS1-2. Analyze and interpret data on the properties of substances before and after the substances interact to determine if a chemical reaction has occurred. (Grades 6 - 8) Do you agree with this alignment? |
||
| Click to view other curriculum aligned to this Performance Expectation | ||
| This activity focuses on the following Three Dimensional Learning aspects of NGSS: | ||
| Science & Engineering Practices | Disciplinary Core Ideas | Crosscutting Concepts |
| Analyze and interpret data to determine similarities and differences in findings. Alignment agreement: Science knowledge is based upon logical and conceptual connections between evidence and explanations.Alignment agreement: | Each pure substance has characteristic physical and chemical properties (for any bulk quantity under given conditions) that can be used to identify it. Alignment agreement: Substances react chemically in characteristic ways. In a chemical process, the atoms that make up the original substances are regrouped into different molecules, and these new substances have different properties from those of the reactants.Alignment agreement: | |
Common Core State Standards - Math
-
Represent and interpret data.
(Grade
5)
More Details
Do you agree with this alignment?
-
Display numerical data in plots on a number line, including dot plots, histograms, and box plots.
(Grade
6)
More Details
Do you agree with this alignment?
-
Fluently divide multi-digit numbers using the standard algorithm.
(Grade
6)
More Details
Do you agree with this alignment?
International Technology and Engineering Educators Association - Technology
-
Students will develop an understanding of the relationships among technologies and the connections between technology and other fields of study.
(Grades
K -
12)
More Details
Do you agree with this alignment?
State Standards
Colorado - Math
-
Visual displays are used to interpret data.
(Grade
5)
More Details
Do you agree with this alignment?
-
Display numerical data in plots on a number line, including dot plots, histograms, and box plots.
(Grade
6)
More Details
Do you agree with this alignment?
-
Fluently divide multi-digit numbers using standard algorithms.
(Grade
6)
More Details
Do you agree with this alignment?
Colorado - Science
-
Use the particle model of matter to illustrate characteristics of different substances
(Grade
6)
More Details
Do you agree with this alignment?
Materials List
Each group (regardless of the size of the group) needs:
- 175 round toothpicks (need ~150, but require extras in case of breakage; round toothpicks are stronger than the flat type)
- 300 gumdrops
- 1 roll of masking tape (to mark an area to "contain" the molecules)
- Graph paper, 1 piece per student
- Graph of Global CFC Production, 1952-2000, 1 per group
- Battling for Oxygen Worksheet, 1 per student
The following items are optional, depending on the type of activity data analysis conducted:
- 1 roll of large butcher paper, at least 2 ft. wide x 25 ft. long
- Marking pens
- Tape (to hang butcher paper drawings)
Worksheets and Attachments
Visit [www.teachengineering.org/activities/view/cub_air_lesson08_activity1] to print or download.Introduction/Motivation
Have you ever been sun burnt? How does this happen? Were you in the sun too long? Ultraviolet rays from the sun cause damage to our skin, as seen by sun burns and sun tans. Ozone is one barrier to letting those ultraviolet (UV) rays reach us on Earth.
When an ozone molecule absorbs UV light from the sun, it breaks down into an oxygen (O2) molecule and an oxygen atom (O). Sometimes the oxygen molecule breaks into two oxygen atoms as well. Normally, the free oxygen atom combines with other oxygen atoms or molecules to produce ozone again. Under normal circumstances, ozone is continuously being destroyed and regenerated by the sun's ultraviolet rays. When there are no outside disturbances, this process of breaking down ozone and building it back up occurs at a constant rate that keeps us protected from a lot the sun's harmful UV rays. However, harmful pollutants (such as CFCs from aerosol cans) can also break down ozone by converting it into oxygen molecules and atoms. When this happens ozone breaks down much faster than it can build up and "holes" appear in the ozone layer. These holes are not actual holes, but areas where the ozone layer is so thin that it lets more UV rays through. The air currents that carry the pollution determine where the holes in the ozone exist.
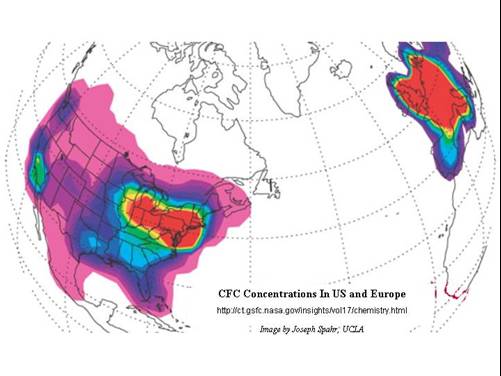
Scientists and engineers have been measuring the ozone layer for many years, and encouraging people to stop the destruction of the ozone layer by reducing the human-created pollutants that contribute to its depletion. The most common ozone-destroying pollutants are in a class of chemical compounds called chlorofluorocarbons (CFCs), which have been used in air conditioner coolants and aerosol spray propellants. Today, many nations and industries have taken steps, including the design of new technologies by engineers, to reduce the production of CFCs and protect the ozone layer from harmful CFCs.
As pollution to the atmosphere increases, the amount of ozone decreases. In other words, an increase in the amount of pollutants that reach the upper atmosphere disrupts the process that makes ozone our safe protective shield. In today's activity, we are going to model just how pollutants destroy ozone.
Procedure
Before the Activity
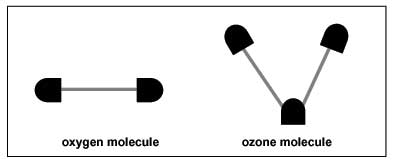
- Make 100 gumdrop molecules, a mix of O2 (oxygen) and O3 (ozone) molecules (see Figure 2). For an oxygen molecule, attach one gumdrop to each end of a toothpick. For an ozone molecule, use two toothpicks and make the molecule in the shape of a "V." If you have time, have the students make the molecules at the start of the activity.
- Consider doing this activity in a common area or gym where you have plenty of space.

With the Students
- Choose three students to be "Ozone Makers" (OMs) and three students to be "UV Light" (UVs) (If the group is fewer than 12 students, assign only one or two students to be OMs and UVs.) These students should be of comparable dexterity and skill at making and disassembling the gumdrop molecules.
- On the floor, use the masking tape to create a circle approximately five feet in diameter (or big enough for 12 children to sit around).
- Place the 100 molecules inside the circle, evenly distributed, along with 50 free (unattached) gumdrops and 25 toothpicks.
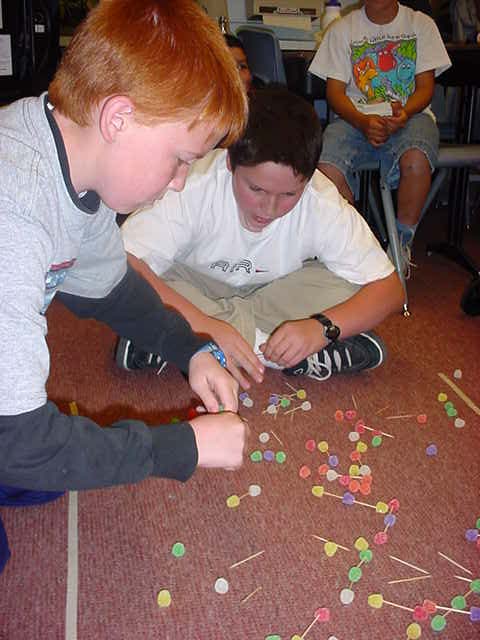
- Say "GO," and give the OM and UV students 30 seconds to assemble or disassemble the molecules as quickly as possible (see Figure 3). The task of the UVs is to "destroy" the existing oxygen or ozone molecules by pulling them apart. The task of the OMs is to assemble oxygen (O2) or ozone (O3) molecules using the free gumdrops and toothpicks, including gumdrops and toothpicks that the UVs are pulling apart. Warn students not to stab themselves with toothpicks!

- If all goes well, at the end of 30 seconds, there should be about as many molecules in the circle as there was at the beginning (about 100 molecules total). Have the students count and record the number of each molecule. Suggestion: Divide the circle into sections and have each student count his or her section, then add them for the total; this is quicker and gives the students practice adding!
- Refer to the Global CFC Production Graph, 1952-2000, noting the amount of chlorofluorocarbons in the atmosphere in 1956 (about 100,000 tons).
- Assign one student to be a "CFC" (representing the impact of the 100,000 tons of CFCs in 1956). Repeat the exercise for another 30-second interval, with the OMs assembling molecules, and the UVs and the CFC disassembling the molecules.
- At the end of the interval, count and record the number of molecules remaining. The UVs and CFCs should have "won." In other words, the number of intact molecules should be somewhat less than were present at the beginning of the interval. After counting and recording the number of molecules, restore the number of intact molecules to approximately 100 total, in preparation for the next step.
- Look at the CFC graph again and determine the number of CFCs that were present in 1962 (200,000 tons, or two CFC students). Add the appropriate number of CFC students (if you originally started with three OMs and three UVs, there would now be two total CFCs for a total of eight students), and repeat the run: a 30-second assembly/disassembly interval, with a count and recording of the number of molecules at the end of the time interval.
- Repeat these steps for subsequent years on the CFC graph, adding or subtracting (especially after 1988!) the appropriate number of CFC students (1 student = approximately 100,000 tons of CFCs). The number of remaining molecules at the end of each run should go up and down accordingly. Remember to start each new run with about 100 molecules.
- Data analysis: After completing the activity with 2000 values (or 1988 values, the maximum, depending on when you choose to stop), it is time to "analyze" the data. There are many options for doing this; here are two suggestions.
- Use the butcher paper to make a striking visual representation of the data. Have the students cut a 2 ft. by 2 ft. square for each run of the exercise. Have them draw the O2 and O3 molecules of a given (consistent) size distributed evenly over the paper. They should only draw as many molecules on the paper as were left at the end of the respective run (that is, approximately 100 molecules pre-1965, approximately 0-10? molecules in 1988). (Time-saving tip: Some students could be working on these drawings while the other students are conducting the activity. For example, after the first few runs, a few students could start drawing the first picture while the other students continue with subsequent runs. Students can trade responsibilities so everyone gets a chance to build or destroy molecules.) Place the drawings in chronological order so students can see the effect over time of CFCs on the number of O2 and O3 molecules in the atmosphere.
- Have students make their own bar graphs of this data (before or after drawing the pictures) of the number of O2 and O3 molecules vs. the year. (Note: The trends should be opposite of those on the CFC graph.)
- Class discussion: After the activity, have the students answer the following questions, and discuss as a class:
- Who were the OMs? (Answer: The OMs were the free oxygen atoms in the atmosphere, bonding together due to their chemical attraction for each other.)
- Who were the UVs? (Answer: The UVs were dangerous ultraviolet radiation from the sun, trying to get to Earth where they can cause damage and sickness.)
- Why didn't any UVs get to Earth during the first run? (They should not have been able to!) (Answer: Even though the UVs were breaking the molecules, the oxygen atoms were recombining to form oxygen and ozone just as fast, so they were able to absorb UV once again. This represents a natural balance in the atmosphere.)
- Why didn't the number of OMs grow with the number of CFCs? (Answer: There are a limited number of oxygen atoms in the atmosphere. They are attracted to each other [this is how they bond], but this attraction does not grow even if more CFCs are tearing them apart because CFCs bond to the individual atoms so they can not re-bond with other oxygen atoms to form oxygen or ozone. For example, each chlorine atom can destroy 100,000 ozone atoms during its lifetime.)
- Where do the CFCs go? (Answer: Discuss the fact that in reality, all of the students who represented the presence of CFCs since 1952 should still be disassembling molecules in 2000, because the CFCs that entered the atmosphere since 1950 are still there, and will be for quite some time [chlorine-containing compounds can last 60-400 years in the atmosphere!]. Scientists expect the ozone hole to remain for 50-100 years, even though fewer new CFCs are being introduced to the atmosphere today.)
- Looking on the CFC graph, when do you think CFCs started to become prohibited from production by many countries? (Answer: The graph shows a dramatic drop after 1988. After much research by scientists all over the world, governments decided that something had to be done to stop the ozone depletion of the ozone layer. In 1987, 24 countries signed a treaty aiming to save the ozone layer. This Montreal Protocol called for a reduction in the production of ozone depleting substances [but not all ozone-depleting substances], aiming to reduce CFCs by 50% by the year 2000. Since then, alternatives have been found to fulfill the roles of CFCs and the amounts being released to the atmosphere have dramatically reduced. However the ozone hole is still a problem needing to be carefully monitored.)
- Have the students complete the Battling for Oxygen Worksheet, which includes questions about the activity and interpreting a graph.
Modified Activity (for a more energetic group!)
This modified activity uses the same size group(s) and materials.
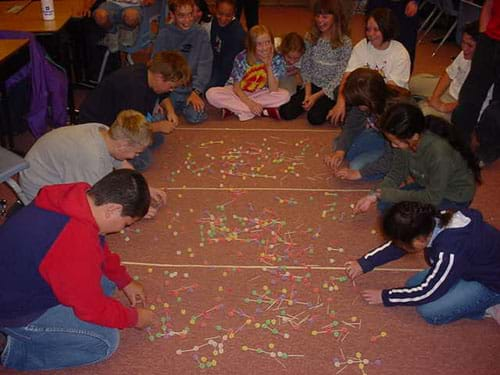
- Rather than making a circle with masking tape, make three rectangular lanes, 2-3 ft. wide and 4 ft. long (see Figure 4).
- Assign each of the OMs one lane and put them at the end of their lane.

- Assign each of the initial UVs one lane and put them at the end of their lane, opposite the OMs.
- Distribute the molecules and free atoms (gumdrops and toothpicks) approximately evenly between the three lanes.
- At Go, the OMs begin manufacturing molecules and the UVs begin tearing them apart, as before. This time, however, the UVs goal is to completely empty their lane of molecules. When this is accomplished, s/he must quickly move through the lane to the OMs side. S/he is now free to attack Earth and cause cancer, etc.
- OMs can help each other and place molecules in any of the lanes, but UVs must only disassemble molecules in their lane.
- After one run (set a short time limit of 30-60 seconds), refer to the Global CFC Production Graph, 1952-2000, and add the appropriate number of CFCs. These CFCs can choose any lane (on the UV side), and they work to help clear the lane for the UV to run through. CFCs can disassemble molecules in any lane they want, but UVs are still restricted to their assigned lane.
- Repeat the activity for as many "years" as is desired, noticing how adding CFCs allows more UVs to reach the "Earth" (the OMs' side).
Assessment
Pre-Activity Assessment
Discussion: Ask the students and discuss as a class:
- Have you ever been sun burnt? How does this happen? Were you in the sun too long? (Discussion points: Ultraviolet rays from the sun cause sun burns and sun tans on our skin. The ozone layer is one barrier to letting those ultraviolet rays reach us on Earth.)
Activity Embedded Assessment
Drawing the Data: Use the butcher paper to make a striking visual representation of the data. Have the students cut a 2 ft. by 2 ft. square for each run of the exercise. Have them draw the O2 and O3 molecules of a given (consistent) size distributed evenly over the paper. They should only draw as many molecules on the paper as were left at the end of the respective run (that is, approximately 100 molecules pre-1965, approximately 0-10? molecules in 1988). (Time-saving tip: Some students could be working on these drawings while the other students are conducting the activity. For example, after the first few runs, a few students could start drawing the first picture while the other students continue with subsequent runs. Students can trade responsibilities so everyone gets a chance to build or destroy molecules.) Place the drawings in chronological order so students can see the effect over time of CFCs on the number of O2 and O3 molecules in the atmosphere.
Post-Activity Assessment
Worksheet: Have the students complete the Battling for Oxygen Worksheet, which includes questions about the activity and interpreting a graph.
Question/Answer: Ask the students the questions at the end of the Procedure section, and discuss as a class.
Safety Issues
- Advise students who are moving about the room to remain calm and not bump into each other.
- Warn students not to stab themselves with toothpicks.
Troubleshooting Tips
Space can be a problem so beware of students colliding. Consider using an open common area or gym for the activity.
This activity is planned for a class of 24 students working in two groups of 12 students each. While this activity works best in large groups, it can be modified for group as small as five students.
Activity Extensions
Have students diagram how CFCs break the bonds in oxygen atoms.
Have students diagram what happens when the sun's rays enter an ozone layer with and without a hole, as well as the effects this has on the Earth's surface.
Have students research what other global-wide steps have been taken to reduce the emissions of CFCs into the atmosphere since the 1987 Montreal Protocol on Substances that Deplete the Ozone Layer. (For example, a 1990 update to the Montreal Protocol was signed by 70+ nations, and a 1992 Copenhagen meeting resulted in an agreement by many nations.) What changes are being made? Is it working? (By 1992, global CFC production was one half of the 1988 production, the historic high, and down to the 1972 level.) Are you using any CFC products in your daily life or home? How are governments, scientists and engineers involved?
Activity Scaling
- While this activity is suitable for any age level, for younger students, consider using a smaller number of molecules at the beginning, and creating the graph as a class project.
- For older students, have them convert the change in O3 to a percentage. For example, if there are 100 molecules of O3 at the beginning, and there are 88 left after a given run, that would be a (100-88)/100 x 100 = 12% change.
Subscribe
Get the inside scoop on all things Teach Engineering such as new site features, curriculum updates, video releases, and more by signing up for our newsletter!More Curriculum Like This

Students explore the causes and effects of the Earth's ozone holes through discussion and an interactive simulation. In an associated literacy activity, students learn how to tell a story in order to make a complex topic (such as global warming or ozone holes) easier for a reader to grasp.

After seeing ultraviolet-sensitive beads change color and learning how they work, students learn about skin anatomy and the effects of ultraviolet radiation on human skin, pollution's damaging effect on the ozone layer that can lead to increases in skin cancer, the UV index, types of skin cancer, AB...

Students are introduced to the concepts of air pollution, air quality, and climate change. The three lesson parts (including the associated activities) focus on the prerequisites for understanding air pollution. First, students use M&M® candies to create pie graphs that express their understanding o...

Through an overview of some of the environmental challenges facing the growing and evolving country of China today, students learn about the effects of indoor and outdoor air pollution that China is struggling to curb with the help of engineers and scientists.
References
Chlorinated Fluorcarbons (CFCs), Man-Made Chemicals, Global Change Course. Global Learning Resource Network, Iowa State University. Accessed September 1, 2020. http://www.meteor.iastate.edu/gccourse/chem/ozone/chlorinated.html
Global CFC Production. Updated 1998. Chapter Two: The State of the Environment – Global Issues Figure, GEO-2000, Global Environment Outlook, United Nations Environment Programme (UNEP). Accessed November 9, 2004. (Good graph of global CFC production, 1986-1996, comparing contributions from industrialized countries and developing countries.) Originally found at http://www.unep.org/geo2000/english/i26a.htm
Global CFC (chlorofluorocarbon) Production, Environment Canada. Updated 2002. United Nations Environment Programme Ozone Secretariat, Kenya. Accessed November 9, 2004. (CFC production data 1950 to 1997; Excel file to download.) Originally found at http://www.ec.gc.ca/
Ozone Depletion (archive of links for various articles on this topic). Updated June 15, 2004. FAQs.org. Accessed September 1, 2020. http://isc.faqs.org/faqs/ozone-depletion/
Rekacewicz, Philippe. Global CFC Production. Updated March 17, 2003. UNEP (United Nations Environment Programme) GRID-Arendal, Norway. Accessed November 9, 2004. (Good graph of global CFC production, 1950-1992, with the Montreal Protocol marked.) Originally found at http://sedac.ciesin.columbia.edu/ozone/
SEDAC: Stratospheric Ozone and Human Health Project. Columbia University, New York City. Accessed July 24, 2004. Originally found at http://sedac.ciesin.columbia.edu/ozone/
Stattersfield, Eloise. High Level Ozone. University of Bristol, UK. Accessed September 1, 2020. (Very good summary information.) http://www.chm.bris.ac.uk/motm/ozone/high.htm
Stratospheric Ozone Information for Children. Updated September 20, 2002. Kidzone, The Green Lane, Environment Canada. Accessed December 21, 2011. Originally found at http://www.ec.gc.ca/ozone/
Copyright
© 2004 by Regents of the University of Colorado.Contributors
Amy Kolenbrander; Tom Rutkowski; Janet Yowell; Natalie Mach; Tyman Stephens; Malinda Schaefer Zarske; Denise CarlsonSupporting Program
Integrated Teaching and Learning Program, College of Engineering, University of Colorado BoulderAcknowledgements
The contents of this digital library curriculum were developed under a grant from the Fund for the Improvement of Postsecondary Education (FIPSE), U.S. Department of Education and National Science Foundation GK-12 grant no. 0338326. However, these contents do not necessarily represent the policies of the Department of Education or National Science Foundation, and you should not assume endorsement by the federal government.
Last modified: September 1, 2020


User Comments & Tips