Quick Look
Grade Level: 9 (9-10)
Time Required: 3 hours
(ideally one 45-minute session, one 90-minute session, and another 45-minute session)
Expendable Cost/Group: US $0.00
Group Size: 3
Activity Dependency: None
Subject Areas: Data Analysis and Probability, Measurement, Number and Operations, Problem Solving, Reasoning and Proof, Science and Technology
NGSS Performance Expectations:

| HS-ETS1-3 |
Summary
Teams of students become startup car companies aiming to win a contract with Porsche. The project requires them to design and build four prototype vehicles using plastic bricks. They then take on various engineering roles to plan a production floor layout and run a simulated production process. After analyzing their initial performance and making improvements, a second simulation determines which team wins the contract based on the number of high-quality vehicles they produce. The project concludes with each team creating a report using data from both simulations to evaluate their performance and suggest future improvements.Engineering Connection
Mechanical engineers design and test physical devices, from engines and machines to consumer products, applying principles of motion, energy, and force. Industrial engineers focus on optimizing entire processes and systems, figuring out the most efficient ways to use people, materials, and equipment to reduce waste and improve productivity in a wide range of industries. Finally, systems engineers take a big-picture approach, overseeing the entire lifecycle of a complex project to ensure that all of the different components and teams work together seamlessly and efficiently to achieve a shared goal.
Learning Objectives
After completing this activity, students will be able to:
- Design and implement a vehicle production system that integrates principles associated with craft manufacturing concepts and engineering roles using the engineering design process.
- Analyze performance data to evaluate their production system, then design and implement revisions, to maximize the number of vehicles and profit they can build within the allotted time.
- Evaluate and reflect on the performance of the initial and revised systems and propose potential next steps.
Educational Standards
Each TeachEngineering lesson or activity is correlated to one or more K-12 science,
technology, engineering or math (STEM) educational standards.
All 100,000+ K-12 STEM standards covered in TeachEngineering are collected, maintained and packaged by the Achievement Standards Network (ASN),
a project of D2L (www.achievementstandards.org).
In the ASN, standards are hierarchically structured: first by source; e.g., by state; within source by type; e.g., science or mathematics;
within type by subtype, then by grade, etc.
Each TeachEngineering lesson or activity is correlated to one or more K-12 science, technology, engineering or math (STEM) educational standards.
All 100,000+ K-12 STEM standards covered in TeachEngineering are collected, maintained and packaged by the Achievement Standards Network (ASN), a project of D2L (www.achievementstandards.org).
In the ASN, standards are hierarchically structured: first by source; e.g., by state; within source by type; e.g., science or mathematics; within type by subtype, then by grade, etc.
NGSS: Next Generation Science Standards - Science
| NGSS Performance Expectation | ||
|---|---|---|
|
HS-ETS1-3. Evaluate a solution to a complex real-world problem based on prioritized criteria and trade-offs that account for a range of constraints, including cost, safety, reliability, and aesthetics, as well as possible social, cultural, and environmental impacts. (Grades 9 - 12) Do you agree with this alignment? |
||
| Click to view other curriculum aligned to this Performance Expectation | ||
| This activity focuses on the following Three Dimensional Learning aspects of NGSS: | ||
| Science & Engineering Practices | Disciplinary Core Ideas | Crosscutting Concepts |
| Evaluate a solution to a complex real-world problem, based on scientific knowledge, student-generated sources of evidence, prioritized criteria, and tradeoff considerations. Alignment agreement: | When evaluating solutions it is important to take into account a range of constraints including cost, safety, reliability and aesthetics and to consider social, cultural and environmental impacts. Alignment agreement: | New technologies can have deep impacts on society and the environment, including some that were not anticipated. Analysis of costs and benefits is a critical aspect of decisions about technology. Alignment agreement: |
Common Core State Standards - Math
-
Attend to precision.
(Grades
K -
12)
More Details
Do you agree with this alignment?
-
Choose a level of accuracy appropriate to limitations on measurement when reporting quantities.
(Grades
9 -
12)
More Details
Do you agree with this alignment?
-
Summarize, represent, and interpret data on a single count or measurement variable
(Grades
9 -
12)
More Details
Do you agree with this alignment?
International Technology and Engineering Educators Association - Technology
-
Cite examples of the criteria and constraints of a product or system and how they affect the final design.
(Grades
9 -
12)
More Details
Do you agree with this alignment?
Materials List
Each group needs:
- (Optional) Teach Engineering Design Process Chart, Teach Engineering Design Process Poster
- 1 Plastic Brick Kit Components List (Amazon list for ordering brick parts)
Printed Materials
- 4 copies of the Bill of Materials (BOM)
- 4 copies of the Vehicle Design Options & Specifications Sheet
- 10+ copies of Customer Order Form
- 1 copy of the Craft Production Data Analysis Spreadsheet
- 1 copy of the Manufacturing Performance Review Sheet
- 1 copy of the Project Portfolio Rubric
- calculators
- (Optional) Student Survey
- devices to take photos, document prototypes and work on the spreadsheet
- one die
For the entire class:
- laptop/computer with projector to display instructions and time
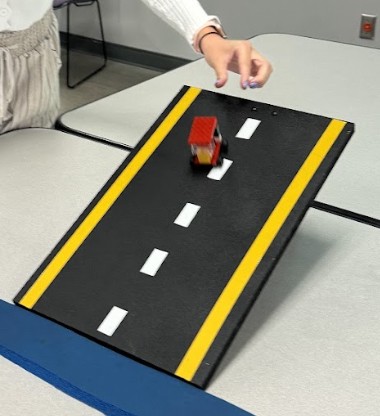
- test area materials for ramp and drop tests (Note: The teachers who contributed to this activity created relatively elaborate versions; therefore, the attached images do not reflect how these materials must appear. Ramp and drop tests can be made from a wide variety of sloped and elevated surfaces, depending on classroom setting and materials available.)
- (Optional Lesson) Branding a Company Logo
- Phase 1 Presentation
- Phase 2 Presentation
- Phase 3 Presentation
Worksheets and Attachments
Visit [www.teachengineering.org/activities/view/uol-3003-craft-production-efficiency-profit-purpose-activity] to print or download.Introduction/Motivation
Today, we are going to explore how small companies manufacture custom products in what we call craft production. Instead of making thousands of identical products like a large factory, craft production companies focus on producing small batches of high-quality, personalized items. Imagine Porsche is looking for a new startup company to assemble four different types of customer orders for their new vehicle design. From among you and your competitors, they will select the group that can deliver the maximum number of high-quality vehicles within their allotted time frame while also earning the highest profit.
In this first phase, you will be exploring how to design your car models using plastic bricks. Just like real engineers, you will have to follow certain guidelines while also being creative. Think of it as “on the job training”; you will get some time to handle the materials before getting down to serious work. Then you will design a production system.
In the second phase, with a craft simulation, you will experience the pressures of building a production line and testing your system to become the top competitor and earn an elite contract with Porsche. You will take on different engineering roles, from designing to sourcing parts, building, and testing. Your goal is to build the cars as quickly and accurately as possible while maximizing profit.
Finally, in the last phase, you will come together to analyze how efficient your team was. Were you able to produce the cars quickly? What was the company’s profit? We’ll be using a Microsoft Excel spreadsheet to help you figure out what worked and what did not. Afterward, you will create a digital portfolio to present to the class.
This is a valuable opportunity to experience real-world craft production in the field of manufacturing and engineering.
Procedure
Background
Craft production is a manufacturing process in which products are made individually or in small batches by skilled workers. Unlike mass production, where each worker performs one repetitive task, craft production involves a single person or a small team building the entire product from start to finish. This approach allows for greater customization, attention to detail, and a strong focus on quality. Craft production has deep roots in tradition and is often associated with handmade goods, artistry, and one-of-a-kind creations.
In this hands-on activity, students will step into the world of craft production and explore the important roles engineers play in making products. Working in small teams, each student will take on a specific role in the production process:
Design engineers plan and guide the vehicle designs to make sure they meet all specifications & requirements.
Sourcing engineers gather and manage the materials needed to build the product according to specifications.
Manufacturing engineers assemble the vehicles, following the design requirements.
Quality engineers (testers) check the final product to make sure it works and looks the way it should.
Before the Activity
Phase 1: Designing Prototypes (Ask-Research-Imagine)
- Optional: You may want to provide a copy of the Teach Engineering Design Process Chart or Teach Engineering Design Process Poster to each team to remind them of previously taught concepts.
- Optional: Students can create and brand their own company logo using the Branding a Company Logo lesson.
- Have the Phase 1 Presentation on the projector.
- Have YouTube video (18:42 minutes) queued up.
- Gather equipment/materials for each group: (student devices, writing tools).
- For each group: plastic brick kits.
- For each group: printed materials, including four copies of the Bill of Materials (BOM) and the Vehicle Design Options & Specifications Sheet.
- Distribute materials to each team.
Phase 2: Designing and Implementing a Production Line: Craft Simulation (Plan-Create-Test-Improve)
- Have the Phase 2 Presentation on the projector.
- For each group: (student devices, one die, graph paper, writing tools).
- For each group: plastic brick kits.
- For each group: 15 copies of the Customer Order Form.
- For whole class: quality testing equipment (ramp & drop test).
- Distribute materials to each team.
Phase 3: Efficiency Analysis and Next Steps (Evaluate-Improve)
- Have the Phase 3 Presentation on the projector.
- Have copies of the Craft Production Data Analysis Spreadsheet, Manufacturing Performance Review Sheet, Project Portfolio Rubric, and (Optional) Student Survey for each team.
- For each group: plastic brick kits.
- Students need a Google Chromebook or device.
- Students will need to retrieve their data collection from the previous day's activity.
- Distribute materials to each team.
During the Activity
Phase 1: Designing Prototypes (45 minutes)
- Optional: Use the Branding a Company Logo presentation to guide students through the process of developing their car production startup company brand and logo.
- Optional: Share a copy of the Teach Engineering Design Process Chart or Teach Engineering Design Process Poster for students to review as needed for the activities.
- Use Phase 1 Presentation Slides 3-8 to introduce the big ideas behind the engineering design process, craft production, and various engineering roles. The YouTube video (18:42 minutes), which shows an example of craft production concepts within a car production system, is embedded in the presentation but may need to be displayed separately.
- Use Phase 1 Presentation Slide 11 to explain to students that each group is in competition to earn a contract with Porsche to produce four car models.
- Slide 11 also states that, although there is a lot of freedom in design choices, state and federal safety and environmental laws, as well as marketing research, dictate some requirements for each model that cannot be changed. The Vehicle Design Options & Specifications Sheet lays out the requirements, including certain characteristics such as weight, the size of certain car parts, and cost.
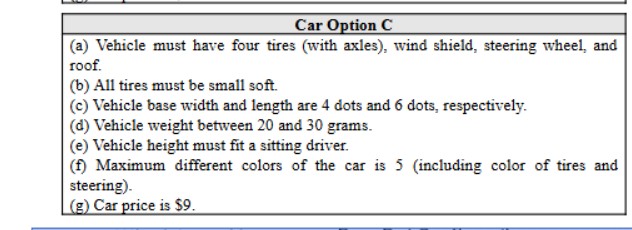
The Vehicle Design Options Specification Sheet conveys the required components, weight, and sale price for each model. - Use Slides 12 and 13 to tell students the Bill of Materials (BOM) forms list the weight and cost of each part of the car, and that they should use these forms to tally the total price and weight of each prototype vehicle they design, to ensure they meet the weight guidelines and cost less than the required sale price.
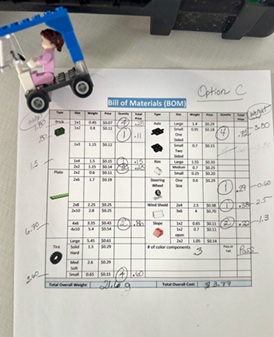
- Allow students time to develop their prototypes, one for each of the four car models on the Vehicle Design Options & Specifications Sheet. Encourage them to test their designs on the ramp and drop test sites.

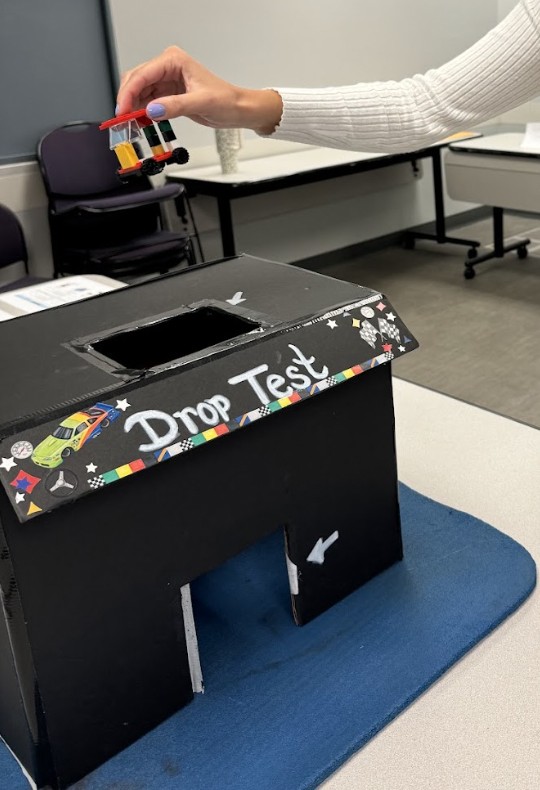
- Use Slide 14 to ask students to use provided devices to take photos of their prototypes and one completed BOM sheet for each.
- Use Slide 15 to reflect and discuss:
In this activity, you took on the role of two different types of engineers.
- Which two do you believe them to be? (Answer: design and sourcing engineers)
- What step(s) in the engineering design process did you apply during this activity?
- How do you know?
- Tell students the next phase will consist of designing the production line they will use to build their cars.
Phase 2: Designing and Implementing a Production Line: Craft Simulation (90 minutes)
- Use Phase 2 Presentation Slides 3-5 to remind students of the previous craft production and engineering role concepts. Also remind students of the iteration component of the engineering design process.
- Use Phase 2 Presentation Slide 6 to remind students they are competing to build the highest number of cars and profit of the groups to earn a contract.
- Use Phase 2 Presentation Slide 7 to tell groups they will now plan and create a diagram of the production area. Ask them to include at least the following:
- Locations of each building station.
- Locations of any engineers who will be placed at various stations.
- Material flow (designing - gathering parts - building).
- How the team will handle quality control and testing of the vehicles. Remind them that each produced vehicle should match the structure of its prototype generated during the design phase.
- Assign a specific location within your plan for required materials, including the supply source (plastic brick kit), completed BOM sheets from the previous activity, and Customer Order Form with a die.
- Make sure they understand that, since there is not an unlimited supply of building materials for the simulation, once a completed car has passed all quality tests, it must be disassembled, and the parts must be replaced in the supply area.
- Use Phase 2 Presentation Slide 8 to explain that a customer “order” will be generated at a designated station, using the roll of a die, and the die number determines which model the customer orders.
- That team member will also label each of the customer order forms with Car #1, Car #2, etc.
- Use Phase 2 Presentation Slide 9 to explain that the BOM completed during the last activity should be used to fill out the Customer Order Form with the required parts for the car model ordered.
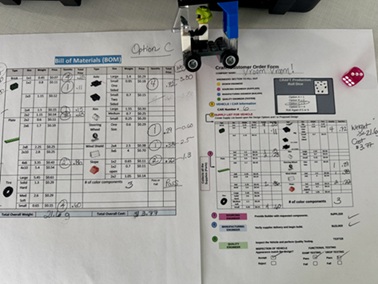
Students use the Bill of Materials form completed in the previous activity to fill out the parts needed in the Customer Order Form. - Have students record the outcomes of the quality tests on the customer order forms.

Quality test outcomes are recorded at the bottom of the Customer Order Form. - After reviewing the required parameters of the production line with the students, give them time to create the diagram of their production floor.
- Use Phase 2 Presentation Slide 10 to give students time to set up their production lines based on their diagrams.
- Use Phase 2 Presentation Slide 11 to let students know that they are about to do a test run of their production lines that will not be used to determine what group gets the Porsche contract. They will test their system by accepting customer orders, aiming to produce the most vehicles and profit in a test run.
- Allow time for students to determine the number of vehicles they were able to construct, and the amount of profit earned (find the sum of the differences between the construction cost and the sale price of all successfully built vehicles).
- Use Phase 2 Presentation Slide 12 to help students reflect on their test performance and discuss/record any potential revisions to their vehicle or production line design.
- Allow students time to implement changes to their vehicles and/or production lines.
- Use Phase 2 Presentation Slide 13 to signal the start of the revised trial, which will be used to determine which team receives the contract.
- Allow students time to determine the number of vehicles they were able to construct, and the amount of profit earned in this round, to determine which group earned the contract.
- Use Slide 14 to celebrate successes and share out with students how the engineering design process guides teams in developing an effective and efficient production line by encouraging thoughtful planning, testing, and continuous improvement.
Phase 3: Efficiency Analysis and Next Steps (45 minutes)
- Use Phase 3 Presentation Slides 3 and 4 to reflect on students’ use of the engineering design process and walk them through the process of completing their Efficiency Report/Digital Portfolio.
- Have students use the Craft Production Data Analysis Spreadsheet and Manufacturing Performance Review Sheet to evaluate the efficiency and effectiveness of their revised production system, based on the number of cars and profit produced.
- Have each team organize their findings into a digital portfolio, using the Project Portfolio Rubric for guidance, and then present their portfolio to the class.
- Optional: Give each student a Student Survey to complete.
Vocabulary/Definitions
bill of materials: A list of parts required to build a product.
craft production: The manufacture of small batches of high-quality, personalized products.
design: The process of planning and creating how something will look and work.
efficiency analysis: The process of checking how well something uses time, money, or resources to get the job done.
engineering: The use of science and math to solve problems and build things that help people.
engineering roles: Different jobs that engineers do to help design, build, test, and improve things like machines, buildings, or systems. Each role focuses on a specific part of solving problems or creating solutions.
prototype: An early sample or model built to test a concept.
quality control: The use of science and math to solve problems and build things that help people.
Assessment
Pre-Activity Assessment
See Phase 1 Presentation Slide 5 to assess students’ prior knowledge and new ideas generated by the video.
Activity Embedded (Formative) Assessment
- Monitor students during the simulation phase to ensure they are following the assembly line instructions.
- Observe how well students are collaborating within their assigned engineering roles and using the engineering design process.
- Listen for students using problem-solving skills when issues arise during assembly or testing.
- Collect quick verbal or written reflections from students on what is working well and what challenges they are facing during the simulation.
- Check that students are accurately recording data on their order forms and spreadsheets.
Post-Activity (Summative) Assessment
Project Report: Product and Production Line Design and Optimization using the Project Portfolio Rubric.
Activity Scaling
For Lower Grades:
- Reduce the Number of Prototypes: Instead of designing and building four different car models, reduce the number of prototypes to two. This will make the activity more manageable for younger students and allow them to focus on quality rather than quantity.
- Simplify the Bill of Materials (Supplier Sheet): Provide a pre-filled Bill of Materials with fewer components. This will reduce the complexity of the sourcing process and help students focus more on the building and design aspects.
- Remove the Efficiency Analysis: Instead of using spreadsheets for efficiency analysis, introduce a basic discussion on how time and materials were managed during the production phase. This makes the activity less technical while still introducing the concept of optimization.
- Use Physical Graphing Instead of Digital: For data analysis, have students plot their production times and successes on physical graph paper rather than using Microsoft Excel or Google Sheets. This allows younger students to practice basic graphing skills and understand visual data representation.
- Provide More Scaffolding and Visuals: Use more visuals and step-by-step instructions in the presentations, along with simplified design sheets to guide students through each phase. This can be particularly useful in keeping students on track.
For Higher Grades:
- Students can create their own data analysis spreadsheet for craft production. You can use the example from this activity as a guide to lead students. This promotes deeper learning, as students will need to build the spreadsheet from scratch in Microsoft Excel, organizing information into columns and rows, and writing formulas to calculate and analyze data. This skill is especially valuable for future engineers, who are often required to design and manage complex spreadsheets in real-world applications.
Subscribe
Get the inside scoop on all things Teach Engineering such as new site features, curriculum updates, video releases, and more by signing up for our newsletter!More Curriculum Like This

Students become “efficiency experts” who have been contracted by an auto manufacturer. They are presented with plans for three car models (made from plastic building bricks) the company currently makes. The current designs are selling well but are not as profitable as the company would like, because...
Copyright
© 2025 by Regents of the University of Colorado; original © 2024 University of LouisvilleContributors
Dr. Faisal Aqlan, University of Louisville, Department of Industrial Engineering; Dr. Liz Popelka-Brown, Seneca High School, Mathematics Teacher, Louisville, KY; Susan Hatfield, Early College & Career Center, Engineering Teacher, Elizabethtown, KYSupporting Program
Research Experience for Teachers (RET), University of Louisville, J.B. Speed School of Engineering, Department of Industrial EngineeringAcknowledgements
This curriculum was developed under National Science Foundation RET grant number 2204601. Any opinions, findings, and conclusions or recommendations expressed in this material are those of the authors and do not necessarily reflect the views of the National Science Foundation.
Last modified: September 16, 2025




User Comments & Tips