Quick Look
Grade Level: 8 (7-9)
Time Required: 45 minutes
Expendable Cost/Group: US $4.00
Group Size: 1
Activity Dependency: None
Subject Areas: Earth and Space, Physical Science
NGSS Performance Expectations:

| MS-PS4-2 |
Summary
Students create and decorate their own spectrographs using simple materials and holographic diffraction gratings. A holographic diffraction grating acts like a prism, showing the visual components of light. After building the spectrographs, students observe the spectra of different light sources as homework.Engineering Connection
Spectrographs are used both in ground-based telescopes and in space to help astronomers answer questions about what makes up atmospheres of planets and stars. Mechanical and electrical engineers design spectrographs to advance our knowledge of astronomy. Simple spectrographs, like the one the students build, are similar to the first spectrographs astronomers used in the past.
Learning Objectives
After this activity, students should be able to:
- Explain that light seen through a diffraction grating shows all of the colors of that light.
- Explain why lights that are the same look the same through the diffraction grating.
- Explain that patterns can tell us something about what kind of light we see.
Educational Standards
Each TeachEngineering lesson or activity is correlated to one or more K-12 science,
technology, engineering or math (STEM) educational standards.
All 100,000+ K-12 STEM standards covered in TeachEngineering are collected, maintained and packaged by the Achievement Standards Network (ASN),
a project of D2L (www.achievementstandards.org).
In the ASN, standards are hierarchically structured: first by source; e.g., by state; within source by type; e.g., science or mathematics;
within type by subtype, then by grade, etc.
Each TeachEngineering lesson or activity is correlated to one or more K-12 science, technology, engineering or math (STEM) educational standards.
All 100,000+ K-12 STEM standards covered in TeachEngineering are collected, maintained and packaged by the Achievement Standards Network (ASN), a project of D2L (www.achievementstandards.org).
In the ASN, standards are hierarchically structured: first by source; e.g., by state; within source by type; e.g., science or mathematics; within type by subtype, then by grade, etc.
NGSS: Next Generation Science Standards - Science
| NGSS Performance Expectation | ||
|---|---|---|
|
MS-PS4-2. Develop and use a model to describe that waves are reflected, absorbed, or transmitted through various materials. (Grades 6 - 8) Do you agree with this alignment? |
||
| Click to view other curriculum aligned to this Performance Expectation | ||
| This activity focuses on the following Three Dimensional Learning aspects of NGSS: | ||
| Science & Engineering Practices | Disciplinary Core Ideas | Crosscutting Concepts |
| Develop and use a model to describe phenomena. Alignment agreement: | A sound wave needs a medium through which it is transmitted. Alignment agreement: When light shines on an object, it is reflected, absorbed, or transmitted through the object, depending on the object's material and the frequency (color) of the light.Alignment agreement: The path that light travels can be traced as straight lines, except at surfaces between different transparent materials (e.g., air and water, air and glass) where the light path bends.Alignment agreement: A wave model of light is useful for explaining brightness, color, and the frequency-dependent bending of light at a surface between media.Alignment agreement: However, because light can travel through space, it cannot be a matter wave, like sound or water waves.Alignment agreement: | Structures can be designed to serve particular functions by taking into account properties of different materials, and how materials can be shaped and used. Alignment agreement: |
International Technology and Engineering Educators Association - Technology
-
Use instruments to gather data on the performance of everyday products.
(Grades
6 -
8)
More Details
Do you agree with this alignment?
State Standards
Colorado - Science
-
Compare and contrast different types of waves
(Grade
8)
More Details
Do you agree with this alignment?
-
Develop and design a scientific investigation regarding absorption, reflection, and refraction of light
(Grade
8)
More Details
Do you agree with this alignment?
Materials List
Each group needs:
- 7-inch (18-cm) high oatmeal container
- 3 x 5 index card
- 1 X-Act-o knife
- 1 holographic diffraction grating (500 lines/mm or 12,700 grooves/in)
- 1 ruler
- colored pencils to draw the spectra
- copies of instructions, questions and homework pages (see Attachment section)
To share with the entire class:
- black spray paint (optional, but desirable)
- masking tape
- 1 incandescent light bulb
- thick black markers
- markers, aluminum foil, glue and other materials to decorate the outside of container
- prism (optional for Introduction/ Motivation section)
- slide projector (optional for Introduction/ Motivation section
Notes on materials:
Ask students to bring oatmeal containers from home.
Purchase holographic diffraction gratings in sheets or on card-mounted slides from:
Rainbow Symphony Store:
https://www.rainbowsymphonystore.com/
A set of 10 12" x 6" linear sheets with 500 line/mm for $25
A set of 50 2" x 2" linear calibrated card mounted slides with 500 line/mm for $20
A set of 100 2" x 2" linear calibrated card mounted slides with 500 line/mm for $35
For Introduction/Motivation Section (optional):
- prism
- slide projector
Worksheets and Attachments
Visit [www.teachengineering.org/activities/view/cub_spect_activity4] to print or download.Pre-Req Knowledge
- Students should have some understanding of the nature of light (such as, rainbows are formed with light, light can be different colors, light can be obscured by physical objects, burning creates light, etc.).
- Students should be able to work with sharp cutting utensils and rulers.
Introduction/Motivation
(Set up a prism, and have a slide projector pointing through the prism such that a rainbow is created. If a prism and slide projector are not available, use a rainbow as an example of light being diffracted by droplets in the clouds.)
A diffraction grating is a special tool that acts like a prism, and a spectrograph is a special tool that allows you to channel light to your eyes. Pure white light is made up of a rainbow of colors that cannot be seen with your eyes. A rainbow is called diffracted light. Light is diffracted (or bent) by the water droplets in the air. A prism does the same thing to light from the projector. Some colors of light bend more than others, and the amount that they bend causes them to line up like a rainbow when they are diffracted. A holographic diffraction grating, like the kind we are going to use today, bends the light just like a prism or water droplets.
Today, we will create a spectrograph, which is a special tool that uses a diffraction grating. This allows you to see things that you cannot see with just your eyes. Your job is to explore light with this new tool just like a scientist, and test your new tool, just like an engineer. Engineers have created different types of spectrographs to help answer questions that arise in astronomy. They test the spectrographs to see how well spectral lines can be seen. When you are building your spectrograph, think about the different factors that go into building it that may affect its accuracy.
Procedure
Terminology Note
In creating the Spectroscopy curricular unit, the Project SPECTRA! program chose to use the term “spectrograph” (as opposed to spectroscope) for the engineering projects activities because a spectrograph is a tool used in spacecraft and modern telescopes, and Project SPECTRA! is an astronomy program. A spectrograph uses a detector, usually a CCD (a charge coupled device, similar to those used in digital cameras), to record the properties of light. Technically, in this unit, students build “spectroscopes,“ which are similar to spectrographs, however, instead of using a detector, the human eye directly observes the light within the scope or projected onto a screen. The primary difference between the two instruments is the method in which the light is detected. A spectrograph enables a person to observe light that cannot be seen with the eye (typically ultraviolet, infrared, and x-rays) because the detector records these wavelengths electronically, enabling the signals to be observed as plots or graphs. In this curricula, when students build their “space-worthy” spectrographs, we consider the students themselves to be the detectors, and leave to their instructors the option of providing students with more in-depth explanation.
Background
See also: Procedure-Background section from the "Graphing a Rainbow" activity.
When photons pass through a gas, they encounter atoms and molecules. The photons hit the atoms and molecules, and produce new photons. When we see this light (these photons) through a spectrograph, we see a pattern of light and dark bands called a spectrum. If the gas that we are looking at is a hot gas, we see an emission spectrum (bright bands on a dark background). If the gas is cool, we see an absorption spectrum (dark bands on a bright background). If two gasses contain the same material and one is hot and the other cool, the hot gas produces bright lines in the exact same places that the cool gas produces dark lines. Where the lines are, whether they are dark or bright, only depends on the material inside the gas. This makes it relatively easy to tell what material is inside of a gas.
The light sources that the students look at in this activity are emission spectra EXCEPT for the Sun's spectrum. The solar spectrum is an absorption spectrum because the "atmosphere" is cooler than the source of the Sun's light. Also, a few absorption lines in the solar spectrum are actually from Earth's atmosphere, which you cannot avoid while on Earth.
When light passes through a material (including gases and liquids), many things may happen to it:
Absorption 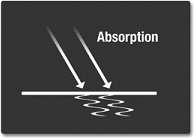
As previously described, the light may be absorbed. This happens when the light photons (or "packages") hit an object, and it's molecules are shaken up by the light. This causes the material to become hotter.
Reflection 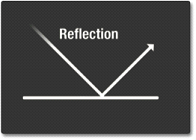
Reflection occurs when light bounces off of a material. The types (wavelengths) of light reflected depend on the composition of the material.
Diffraction 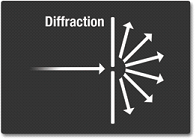
Diffraction occurs when light is bend and spread around an object or a slit.
Scatter 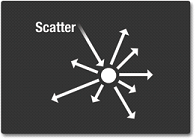
Scattering occurs when light bounces of an object in a variety of direction. The sky is blue due to light scattering. The higher energy (shorter wavelength) light (violet and blue) tends to be scattered by the atmosphere, while the longer wavelength light (yellow and red) does not. Therefore blue and violet and scattered, and the sky appears blue (more blue than violet because human's eyes are more sensitive to blue).
Refraction 
Refraction occurs when light changes direction when passing through an object. The different wavelengths are changed at different rates and allows colors to be separated The previous examples of a glass prism and rain drops are examples of refraction.
Before the Activity
- Ask students to bring in oatmeal containers from home.
- A day before conducting the activity, spray paint (or have students spray paint) the insides of the oatmeal containers black.
- (optional) Complete the "Patterns and Fingerprints," "Using Spectral Data to Explore Saturn and Titan," and "Graphing the Rainbow" activities to help build the students' conceptual knowledge of patterns produced by light and representations of spectral data.
- If holographic diffraction gratings are in sheets, cut into 2-inch x 2-inch (5-cm x 5-cm) squares so that every student gets one square.
- If needed, build a spectrograph to demonstrate to students what the final product should look like and discover any problems they may encounter.
- Print copies of the Build a Spectrograph Student Instructions.
- Gather materials.
- Set up light bulb so students have a continuous spectrum light source to test their spectrographs.
With the Students
- Tell students that their job as engineers today is to design and build a prototype spectrograph for studying a variety of light sources.
- Hand out student instructions that include directions and diagrams for building a spectrograph.
- Cut a small rectangular hole, off-center in the lid of the oatmeal container, approximately 2.5 cm wide by 3.5 cm high.
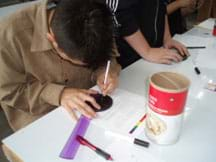
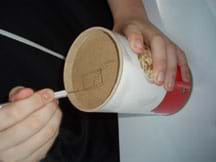
- Cut a hole the same size roughly opposite the hole in the lid on the opposite side of the container.
- Be careful not to cover any portion of the hole with tape. Gently tape the diffraction grating to the inside of the lid.
- Cut 2.5 cm off each short end of the index cards. Keep the two pieces you cut.
- Trim 1.5 cm off the length of the index card pieces.
- Color the index card pieces black using black marker.
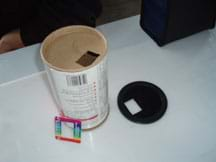
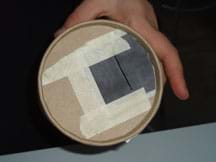
- Using the straightest edge of the index card pieces, tape over the hole in the bottom of the container so that they are almost touching, but not quite. Make a gap of less than 1 mm, as straight as possible. Use masking tape so that no light leaks into the box, aside from the light coming through the gap (slit).
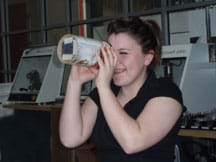
- Put the lid back on, look through the lid, and point your spectrograph at the light source. You should see a continuous spectrum (a rainbow) very clearly. If you do not see a continuous spectrum clearly, rotate just the lid until you do.
- Once your spectrograph is finished, decorate the outside of your container.
Vocabulary/Definitions
absorption spectrum: Dark lines that appear against the continuous spectrum seen through a spectrograph.
continuous spectrum: The rainbow that white light is composed of that can be seen through a spectrograph.
diffraction: When light bends, as through a prism or diffraction grating.
diffraction grating: Usually a piece of film designed to act like a prism.
emission spectrum: Bright lines that appear through the spectrograph against a dark background.
incandescent light bulb: A standard light bulb found in most households.
light source: Any object that produces light.
spectrograph: (also spectroscope)A tool that allows the components of light to be seen easily with the eye.
spectrum: (plural: spectra) The pattern light produces as can be seen through a spectrograph.
Assessment
Pre-Lesson Assessment
Brainstorming: Ask students what they believe causes rainbows to form.
Post-Introduction Assessment
Class Discussion: Ask students if they are familiar with any light that cannot be seen with the naked eye. Accept many answers. Ask if they know of any animals that see differently than humans (for example, snakes, bats, dogs).
Post-Activity Assessment
Engineering Communication Homework: Take students outside with their spectrographs, colored pencils, and homework page to look at the spectrum of the Sun. They can fill it in as their first light source. Never have students look directly at the Sun! Follow the instructions on the homework page to see the Sun's spectrum. Make sure students do not block the paper with their shadows.
Upon returning to the class, emphasize that engineers share information through dialogue, conferences and written papers. Tell students that the way engineers get new ideas is through sharing with peers. Advise students to open their notebooks or engineering journals and write down something they did, discovered or wondered about during the lab. They can use the questions as a guide, or come up with their own statements. Give them a few minutes to write, and then ask for volunteers to share. If no one volunteers, choose a student to share. After the student finishes talking, allow other students to comment (respectfully). When the students finish the discussion, highlight key ideas on the board. Some ideas may be incorrect, but are still worthy of discussion. Be wary of labeling an answer "right" or "wrong" but rather have students demonstrate or discuss why something does or does not make sense. Ask students to write about the activity and what they learned in their journals.
Note: After students complete the homework, call attention to the fact that the same light sources produce the same spectrum. Tie this to the "Patterns and Fingerprints" and "Graphing the Rainbow" activities. Also, note that streetlights that appear blue or whitish-blue to the naked eye are filled with mercury vapor, and streetlights that appear yellow are filled with sodium vapor, thus they have emission bands unique to the substance with which they are filled.
Safety Issues
- Students should know the proper handling procedure for Exact-o knives.
- Never have students look directly at the Sun, and advise students not to look at the Sun.
Troubleshooting Tips
Colorblind and vision-impaired children will have difficulty with portions of this lab. Students with corrective lenses will not have difficulty. Colorblind students can be paired with a student to assist them with the activity and homework.
Students may need assistance adjusting the position of the grating so that a continuous spectrum appears. The lid must be rotated if a continuous spectrum is not visible. Also, the slit should be visible through the grating. The slit should not have any light leaking from the taped portion around it, or the spectrograph will not work properly. Make sure the index card is taped down so that the slit is perfectly straight, and that students have used the "manufactured" edge of the card, not the cut edge.
Students may be confused when they see two spectra through the slit. The diffraction grating produces two spectra, and both are a complete spectrum of the source. Make sure the students choose one or the other, but not both, to draw in the activity and on the homework.
The spectrum of the Sun is very faint through the diffraction grating. It should appear as thin, faint lines on top of the continuous spectrum. If it is cloudy, students will not be able to see the spectrum. Do not expect students to draw the lines exactly, but they should be able to see the very faint spectrum if they are looking carefully. An example appears here:

Activity Extensions
Complete the "Using a Fancy Spectrograph" activity.
Subscribe
Get the inside scoop on all things Teach Engineering such as new site features, curriculum updates, video releases, and more by signing up for our newsletter!More Curriculum Like This

Students use simple materials to design an open spectrograph so they can calculate the angle light is bent when it passes through a holographic diffraction grating. A holographic diffraction grating acts like a prism, showing the visual components of light.

Students find and calculate the angle that light is transmitted through a holographic diffraction grating using trigonometry. After finding this angle, student teams design and build their own spectrographs, researching and designing a ground- or space-based mission using their creation.

Students use the spectrograph from the "Building a Fancy Spectrograph" activity to gather data about different light sources. Using the data, they make comparisons between the light sources and make conjectures about the composition of these sources.

Students learn how using spectrographs helps people understand the composition of light sources. Using simple materials including holographic diffraction gratings, students create and customize their own spectrographs—just like engineers.
References
Doherty, Paul, and Don Rathjen. Exploratorium Science Snacks. 1995/2006. Exploratorium: The Museum of Science, Art and Human Perception. Accessed September 2006 and November 2011. http://www.exploratorium.edu/snacks/
Fisher, Diane. "Taking Apart the Light." "The Technology Teacher." March 2002.
Copyright
© 2007 by Regents of the University of Colorado.Contributors
Laboratory for Atmospheric and Space Physics, University of Colorado at BoulderSupporting Program
Laboratory for Atmospheric and Space Physics (LASP), University of Colorado BoulderAcknowledgements
The contents of this digital library curriculum were developed under a grant from the Fund for the Improvement of Postsecondary Education (FIPSE), U.S. Department of Education, and National Science Foundation GK-12 grant no 0338326. However, these contents do not necessarily represent the policies of the Department of Education or National Science Foundation, and you should not assume endorsement by the federal government.
Last modified: May 14, 2019


User Comments & Tips